hamzaupwork.com

Category: Statistics

  • Statistical Update: External Trade

    This update releases new estimates of the purchase value of goods imported to St Helena during the 2024/25 financial year, and estimates of the value of visitor expenditure in 2024 – an export of services.

    The detailed data tables used to prepare this release can be downloaded here.

    Total value of goods imported

    The total value of goods imported to St Helena during the 2024/25 financial year is estimated to be £30.7 million, an increase of £5.9 million compared to the previous year, or 23.8%.

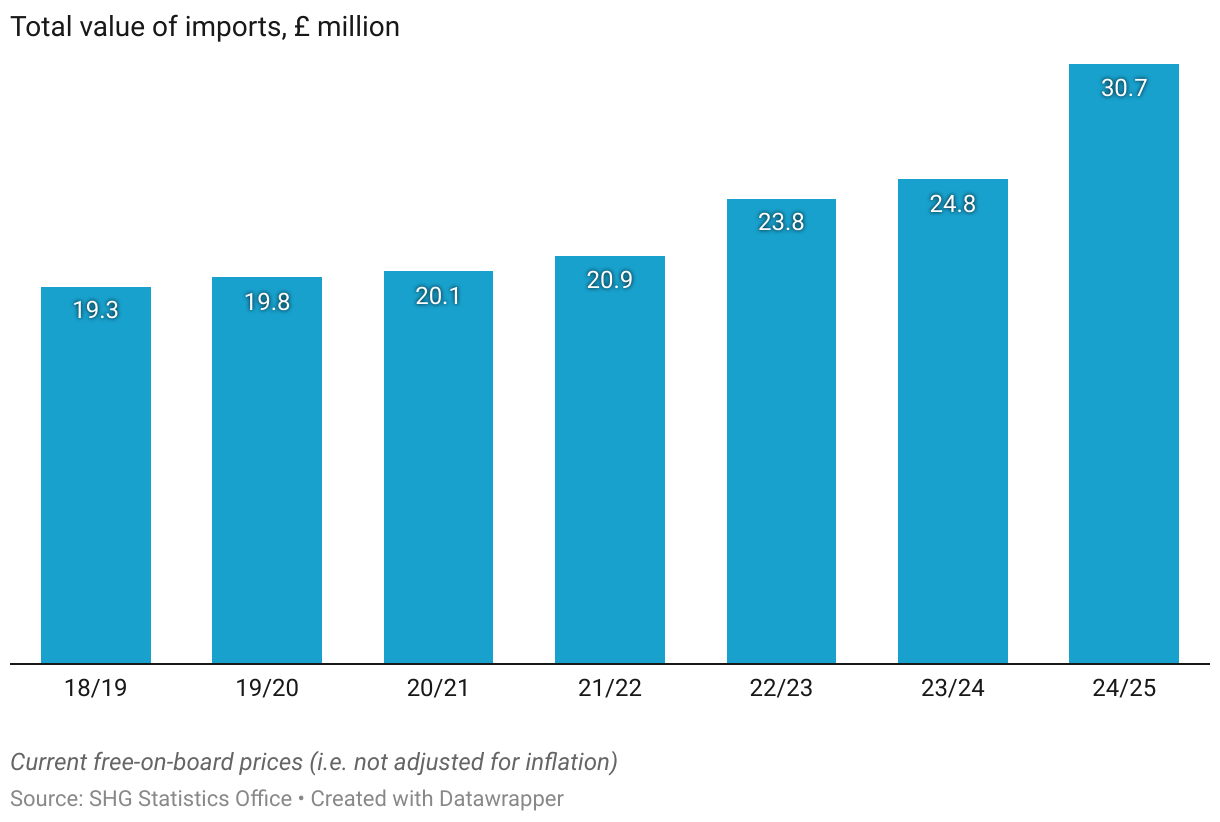
    Note that the value of goods is ‘free on board’, which means that it excludes freight and insurance charges. Value-added taxes, sales taxes and other fees paid by importers are also excluded, since these statistics are compiled from declarations made by importers to the St Helena Customs authorities, which do not require these additional fees to be included. It is also not adjusted for inflation; a common term for this is that the valuation is in ‘current prices’.

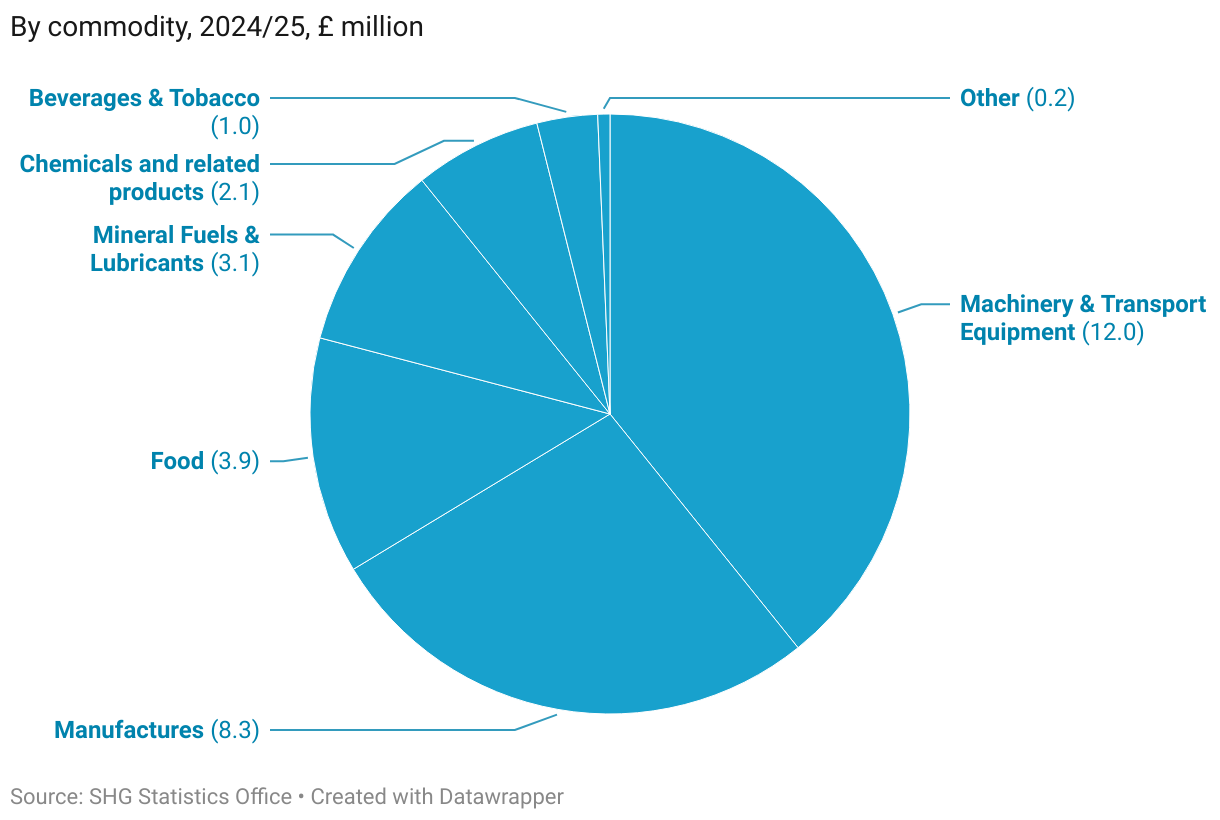
    Type of goods imported

    Goods imported to St Helena predominantly fall into one of four major groups: machinery and transport equipment, manufactured goods and articles, food, and mineral fuel and lubricants. Diesel fuel, which is used in St Helena’s electricity power station, is typically among the largest single items each year, arriving by fuel tanker in regular consignments. In 2024/25 there was a large increase in the value of machinery and transport equipment, resulting from investments in transport and communications infrastructure.

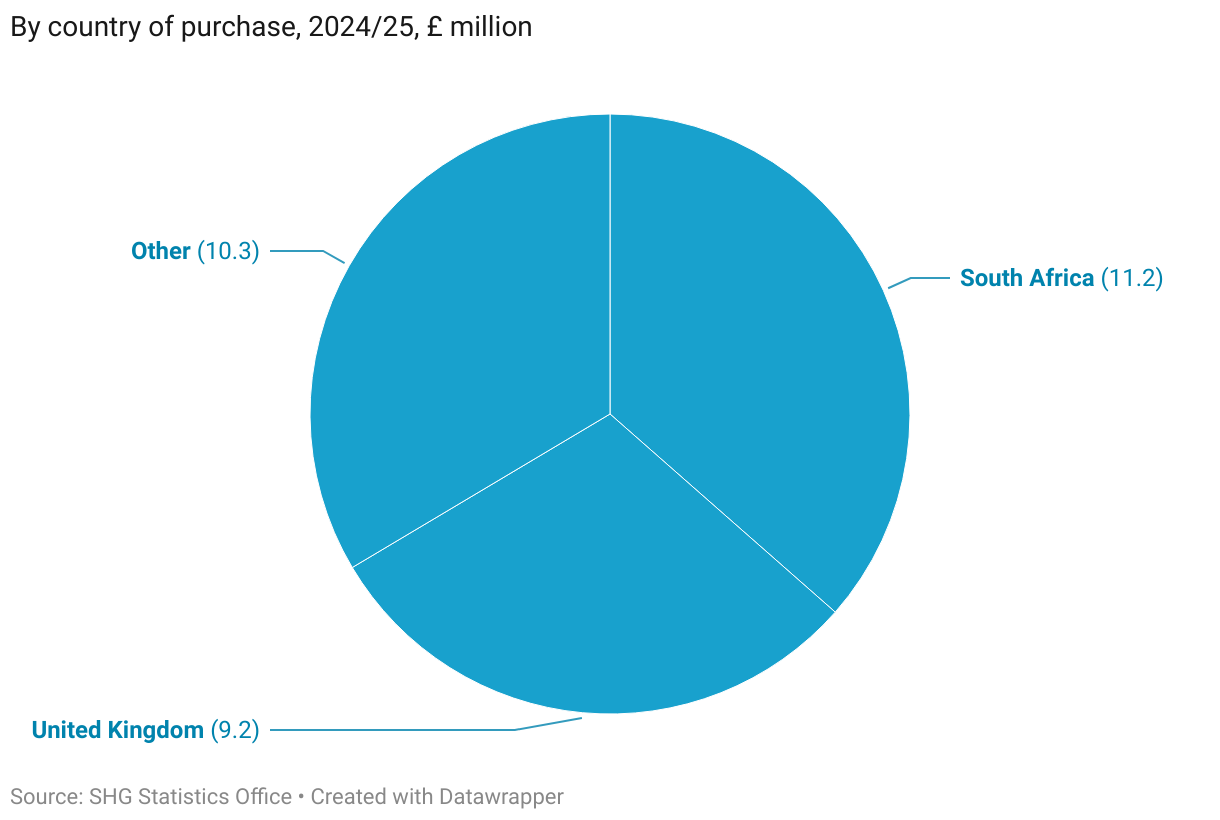
    Country of purchase of imported goods

    Most goods imported to St Helena are purchased in the United Kingdom or South Africa, reflecting the close ties between St Helena and the UK, and the historical cargo shipping routes between Cape Town in South Africa and Jamestown in St Helena. Historically, St Helenians tend to spend roughly the same in the UK and South Africa on imported goods, although slightly more has been spent in South Africa in recent years than in the UK; this may reflect the relative weakness of the Rand compared to the Pound and the lower cost of freight, making South African goods cheaper to purchase. Imports from other countries were mostly mineral fuel (diesel and petrol), and specialised equipment and transport machinery.

    Exports of services (visitor expenditure)

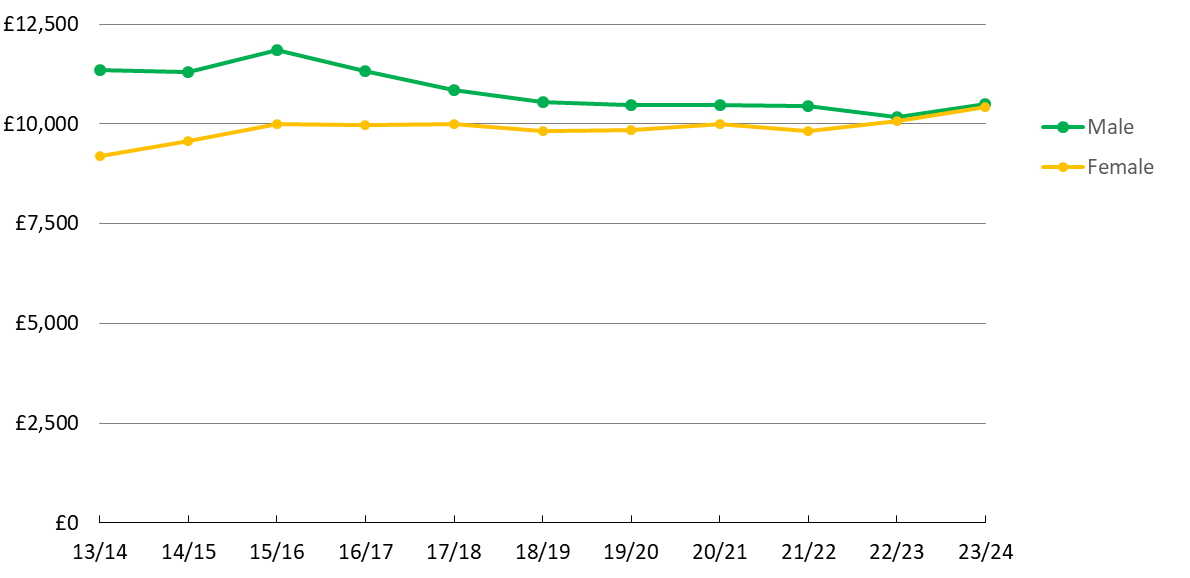
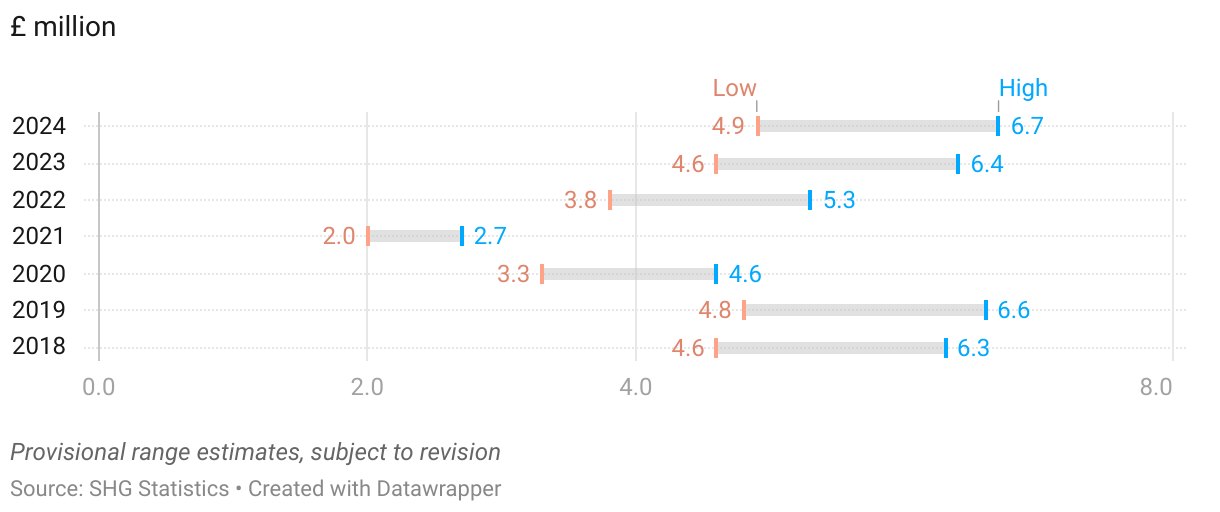
    Exports of St Helena have historically been thought of in terms of goods, such as fish, coffee, and stamps. However spending by visitors to the island is also an export: exports are purchases by non-residents of St Helena of both goods and services. Visitor expenditure far exceeds the value of goods exports, but estimates are not precise and so are given as a range to indicate the level of uncertainty. In 2024, visitors to St Helena are estimated to have spent between £4.9 and £6.7 million (note that the values in the chart and given in current prices, i.e. not adjusted for inflation).

    Range estimates of visitor expenditure, 2024

    Methodology

    Concepts and definitions: The compilation methodology for international trade statistics on St Helena uses the guidelines published by the United Nations Statistics Division. Generally, imports and exports are transactions involving the exchange of goods or services between residents and non-residents of St Helena. For goods, imports and exports are usually recorded whenever a commodity crosses St Helena’s boundaries, typically a border entry point, or a ‘bonded’ warehouse (a place where goods liable to import taxes are stored until those taxes are paid). For the purpose of St Helena’s import statistics, the date of customs duty assessment is usually taken to be a reasonable estimate of the date at which the commodity has effectively crossed the border. Since goods are counted as imported when they enter the domestic economy, goods imported into bonded warehouses are only counted when they are released from bond. Goods imported after being temporarily exported for repair are also not included. Similarly, machinery imported on a temporary basis, for example to support construction products, is not included, if it can be identified. This update focuses on the imports of goods but it should be noted that St Helena’s trade with other countries also includes imports and exports of services. Imports of services include medical treatment and training programmes abroad, communications services, and services delivered by persons visiting the Island but who do not live on St Helena. St Helena’s service exports include spending on St Helena by tourists and short-term visitors; estimates of this non-resident spending on St Helena are available in the detailed data file, here.

    Data source: Statistics on the imports of goods are derived primarily from the administrative records resulting from the Customs process, particularly the legal requirement for a declaration to be made to the Customs authorities whenever goods are imported or exported. These declarations are stored in a computer system called ASYCUDA, managed by the Customs Office. Although the Statistics Office conducts a number of consistency checks to identify and correct valuation and classification errors, the data quality of statistics on international trade depends on the quality of information entered into the ASYCUDA system by importers and by Customs officials. The quality of the information collected by the Customs Office on the quantities of commodities imported does not currently permit the calculation of trade statistics on volumes or quantities.

    Valuation method: Values are reported in ‘current’ prices, that is, the value recorded at the time of the customs transaction, without any adjustment for price inflation (i.e. the changes in prices of commodities over time). On St Helena, the value recorded by importers for the assessment of import taxes and duties is ‘free-on-board’ (or FOB), rather than inclusive of ‘cost, insurance and freight’ (or CIF); import statistics are therefore also based on the FOB valuation of goods. This means that St Helena’s import statistics are based on the invoice value paid by the importer in the country of purchase, and they do not include the costs of shipment, or any duties or taxes paid in that country. Goods purchased in foreign currencies are valued in Pounds based on the exchange rate used for the Customs transaction, rather than the exchange rate used by the importer when they purchased the goods. If the rate used for the Customs transaction is not known, the average monthy ‘spot’ rate published by the Bank of England is used.

    Classification of commodities: Commodities are classified by importers on their customs declarations using an eight digit tariff code, which is based on the international six digit ‘Harmonised System’ classification maintained by the World Customs Organisation. In this report, and for the presentation of St Helena’s trade statistics generally, the Standard International Trade Classification is also used; this was developed for analytical purposes by the United Nations Statistics Division, while the Harmonised System is primarily designed for the administration of Customs systems. There are ‘correspondence tables’ between these two classification systems maintained by the United Nations, which enables St Helena’s trade statistics to be analysed and presented using either classification.

    Frequency: The trade statistics in this update are presented by financial year, and the Statistics Office currently analyses the ASYCUDA database every year. However, data are computed by quarter, which can allow calculation of trade statistics by calendar year, or by quarter if required. Any analysis of quarterly import statistics should be made with care, however, since they can be affected by the timing of cargo shipments and other issues.

  • Statistical Update: Arrivals and Departures

    The latest provisional estimates have been released for the numbers of passenger arrivals and departures to and from St Helena, up to the end of June 2025.

    Note: Estimates of the arrivals of St Helenians and those arriving for leisure are not yet available for January 2025 onwards, due to a change in immigration arrival procedures.

    Arrivals

    In June 2025, there were an estimated 278 arrivals, with 215 arriving by air; this compares with 196 arrivals in June 2024, with 184 arriving by air.

    https://datawrapper.dwcdn.net/EA4bJ/30/

    During the last 12 months (July 2024 to June 2025) there have been 5,298 arrivals, compared to 4,344 in the same period a year ago – a 22% increase.

    Departures

    In June 2025 there were an estimated 295 departures from the island, 17 more than the number of arrivals. During the last 12 months (July 2024 to June 2025), there were a total of 5,261 departures, compared to 4,425 in the same period a year ago – an increase of 18.9%.

    https://datawrapper.dwcdn.net/KlqTH/25/

    Get the data

    A file in Excel format with detailed monthly statistics on arrivals and departures to June 2025 can be downloaded here.

  • Statistical Update: Population

    The St Helena Statistics Office has released new provisional estimates of the number of people on St Helena by age, sex, residency and nationality, and the number of births and deaths, up to the end of December 2024. Estimates of selected indicators are also available up to June 2025, wherever data are available to enable calculation.

    At the end of December 2024 there were an estimated 4,514 people on the island, an increase of 226 from the end of November, when there were an estimated 4,288. Of the people on the island, 3,941 people were estimated to be residents, and 573 were estimated to be visitors. This compares to an estimated 3,991 residents on the island at the end of November, and 4,099 on the island a year ago, at the end of December 2023.

    https://datawrapper.dwcdn.net/BKVr4/34/

    Compared to a year ago, at the end of December 2023, there has been a decrease in the number of resident children on-island (0-14 years) from 518 to 487, and a decrease in those of roughly working age (15-64 years) from 2,434 to 2,299. But the number of people aged 65 and over increased, from 1,147 to 1,155. The Old Aged Dependency Ratio of the resident on-island population (the number of those 65 and over compared to those of roughly working age) was 50.2 at the end of December 2024.

    The chart illustrates the estimated St Helenian resident population at the end of December 2024 by five-year age groups and sex. The age group with the smallest number of St Helenians is 0-4 (120), followed closely by 20-24 (127) and 25-29 (137); the age groups with the most are 55-59 and 60-64, with 340 and 339 people respectively.

    https://datawrapper.dwcdn.net/1Wutc/16/

    Please note that St Helenians are no longer asked for their residence status when they enter St Helena, which means that the classification of St Helenian arrivals into residents and visitors may be less reliable than in the past, and data revisions are more likely.

    A data file with monthly population estimates to the end of December 2024 can be downloaded here. The file includes population totals by age, sex, residency and nationality, and the number of arrivals, departures, births, and deaths.

  • Statistical Update: Gross Domestic Product

    New estimates of economic activity on St Helena for 2023/24, and revisions to earlier years

    This release presents new estimates of Gross Domestic Product (GDP) and Gross National Income (GNI) for 2023/24, and revisions to previously published estimates from 2017/18 onward.

    The statistics and indicators presented in this Bulletin can be downloaded in Excel format here.

    All estimates presented in this release should be considered provisional: GDP estimation is a complex task and developing appropriate methods and data sources is an ongoing program of work.

    Gross Domestic Product

    GDP is a key indicator of economic activity used around the world: on St Helena it measures the total value of all the goods and services produced on the island during a year. For 2023/24, GDP at ‘market prices’ (which is the measure usually used) is estimated to be £39.4 million. Compared to 2022/23, the volume of goods and services produced by the economy is estimated to have fallen by 3.7%, a decrease in GDP in real terms (i.e. adjusting for price inflation) of around £1.5 million (Table 1).

    Table 1. Estimates of Gross Domestic Product, 2019/20 to 2023/24, £ million

    19/2020/2121/2222/2323/24
    Current basic prices37.239.037.939.539.2
    Current market prices38.440.439.539.839.4
    Constant 23/24 market prices41.843.441.840.939.4
    Annual GDP growth rate-4.8%3.8%-3.9%-2.1%-3.7%

    Over the last five years, from 2019/20 to 2023/24, GDP has fallen in real terms by 5.7%. But the total number of people on St Helena who contribute to GDP – both residents and visitors – on St Helena has also fallen, from an estimated average of 4,563 in 2019/20 to 4,277 in 2023/24 – a similar drop of 6.3%.

    Adjusted for the size of the population, GDP was estimated to be £9,210 per person in 2023/24, or $11,570 (Table 2). In real terms, when inflation is taken into account, GDP per capita decreased slightly by 2.2% when compared to 2022/23. But over the last five years, GDP per capita has remained at a similar level, increasing very slightly from £9,170 to £9,210 (0.4%) between 2019/20 and 2023/24.

    Table 2. Estimates of Gross Domestic Product per capita, 2019/20 to 2023/24

    19/2020/2121/2222/2323/24
    GDP per capita (£, current)8,4008,9308,9409,1809,210
    GDP per capita (£, constant 23/24 prices)9,1709,5909,4409,4209,210
    Annual GDP per capita growth rate-2.1%4.6%-1.6%-0.2%-2.2%
    Estimate of average on-island population4,5634,5274,4224,3394,277
    GDP per capita ($, current)10,71011,69012,22011,06011,570

    Breakdown of GDP by industrial activity

    Table 3 shows the share of total value added by each major activity grouping (industrial activities are classified according to Revision 4 of the UN International Standard Industrial Classification, grouped to avoid disclosure of information about individual companies). Value added is the key component of GDP, and represents the total output of sole traders, businesses, government, and non-profit organisations, less the value of intermediate consumption (i.e. the value of goods and services used in the process of producing final goods or services). Note that there have been significant revisions to these estimates for previous years, as a result of better categorisation of value added to sectors, for Government activities and for some companies.

    The largest sector in the economy in 2023/24 was Public Adminstration (18.1%), followed by Finance, Insurance, Information, and Communication (16.5%), and Health and Social Service Activities (15.5%). These three groups of activities account for just over a half of all value added in the economy (50.1%).

    Table 3. Value Added by industrial activity, 2023/24

    Value added (£m)Share (%)
    A: Agriculture, Forestry and Fishing0.822.1
    B, C, D, E: Quarrying, Manufacturing, Electricity, Water, and Sanitation3.158.0
    F: Construction2.135.4
    G: Wholesale and Retail Trade; Repair of Motor Vehicles4.5811.7
    H: Transportation and Storage2.215.6
    I: Accommodation and Food Service Activities0.651.7
    J, K: Finance, Insurance, Information, Communication6.4816.5
    L: Real Estate Activities1.945.0
    M, N, R, S: Other Activities and Services2.035.2
    O: Public Administration7.0818.1
    P: Education2.065.3
    Q: Health and Social Service Activities6.0715.5
    Total39.17100.0
    Note: Government activities (mostly Public Administration, Education, Health and Social Service activities) are valued net of depreciation. Percentage shares may not add to 100% due to rounding.

    Gross National Income

    A useful alternative measure to GDP is called Gross National Income (GNI), which values the economic activity of the Island’s residents, regardless of where that activity takes place. This is different to GDP, which is a measure of the total value of goods and services produced within the territorial boundaries of St Helena, regardless of whether that value is produced by its residents. GNI is derived from GDP by adding an estimate of the income earned abroad by residents and deducting an estimate of the income earned on St Helena by non-residents.

    Table 4 shows the nominal levels of GNI and GNI per capita since 2019/20. St Helena’s estimated GNI per capita level is not yet high enough to have crossed the World Bank threshold that defines a ‘high income’ country. One important implication of this is that the financial support it receives from the United Kingdom and other official aid donors is classified as Official Development Assistance.

    Table 4. Gross National Income, 2019/20 to 2023/24

    19/2020/2121/2222/2323/24
    Current market prices (£ million)37.440.038.739.038.2
    Per capita, current prices, £8,2108,8508,7608,9808,930
    Per capita, current prices, $10,46011,57011,97010,82011,220
    World Bank high income threshold $12,53512,69513,20513,84514,005

    Notes and Methodology

    Revisions: GDP estimation and measurement methods are complex and development of St Helena’s National Accounts is an ongoing programme of work. All estimates published in this bulletin should be considered provisional and subject to future revision as additional data sources become available and further improvements are made to the methodology. This release includes several revisions, including improved methods for estimating the contribution of certain financial services, adjustments to the treatment of government subsidies to some state-owned enterprises, and the use of new data sources to estimate the different types of activities performed by government and by large enterprises. Revisions have been incorporated from 2017/18 onwards to ensure comparability over time. Table 5 provides a comparison of the revised estimates to those previously released, for total GDP at current market prices.

    Table 5. Revisions to total GDP at current market prices, 2017/18 to 2022/23

    17/1818/1919/2020/2121/2222/23
    Previous estimates, £ million36.239.238.039.439.039.3
    Revised estimates, £ million37.139.638.440.439.539.8
    Change (%)2.71.20.92.81.21.3

    Approach: There are three basic methods of compiling total GDP: the expenditure, income, and production (or output) approaches. Prior to 2016, St Helena published estimates based on the expenditure approach, and in 2016 a figure for 2014/15 was published based on the income approach. This Bulletin presents estimates based on the production approach. As far as practicable in a small economy with limited resources for compiling GDP statistics, the methods used aim to follow the international guidance published in the 2008 System of National Accounts by the United Nations.

    GDP at basic prices: Estimates at basic prices are derived as the sum of the gross value added of companies and government consumption expenditure, plus the incomes of sole traders, and an estimate of the rental value derived by households from the owner-occupation of their homes. The valuation of the output of government has been made on a net basis, excluding an estimate of asset depreciation (this is common in other small countries). Taxes on production are small and have not generally been included, so the value of GDP at basic prices is roughly equivalent to factor cost.

    GDP at market prices: To be consistent with the guidelines issued by the United Nations, GDP at market prices is derived by adding total indirect taxes on products and production (including customs duties and service taxes) to total GDP at basic prices, and subtracting regular government subsidies to companies (these subsidies are included in the sectoral breakdown of GDP at basic prices).

    Inflation adjustment: Estimates are presented in both nominal and real terms, referred to in this release as current prices and constant 2023/24 prices. Estimates in nominal terms will change due to both the effect of price changes and because of growth in the size of the economy. But changes in the size of the economy can only be measured using estimates expressed in real terms, adjusted for price inflation (i.e., using constant prices). Estimates in real terms have been calculated by applying the recommended method of using specific inflation estimates for each industrial grouping of economic activity, an improvement on past practice of using St Helena’s Retail Price Index.

    Measurement issues: There are significant measurement difficulties in obtaining accurate source data for estimating GDP and related indicators for St Helena. Additionally the recommended measurement frameworks and concepts are not always well suited to measuring economic activity in small, aid-dependent economies. Estimates are very sensitive to timing issues and to recording or classification conventions, which while appropriate for larger economies may distort trends and levels in smaller countries. There are further measurement difficulties in calculating GNI; in particular, there are very limited data sources to estimate the income earned abroad by resident individuals and companies and the income earned on St Helena by non-resident individuals and companies.

    Per capita estimates: For calculating per capita estimates of both GDP and GNI, the population total used is the average of the end of month on-Island population estimates for the period, as published on the St Helena Government website by the Statistics Office.

    Currency conversion: For converting from St Helena Pounds (£) to United States Dollars ($) the average monthly spot rates published by the Bank of England have been used for each financial year.

    Data sources: The primary sources that have been used to compile GDP and related measures include Income Tax returns, published company accounts, and population estimates published by the Statistics Office. Thanks are extended to all the companies and businesses that have responded to past Business Surveys, to the Income Tax Office for their cooperation and help in using the data from tax returns for this purpose, and to the Immigration Office for their help in using data on arrivals and departures to estimate the size of the population. Data confidentiality is maintained in accordance with the requirements of the 2000 Statistics Ordinance.

    Technical advice and support: Compiling estimates of Gross Domestic Product and related National Accounts is a highly specialised task that has only been possible because of the technical advice and support provided by the Office of National Statistics (ONS) Methodology Advisory Service in the United Kingdom – thanks are especially due to Jim O’Donoghue and Robin Youll.

    Have more questions or comments?

    Please get in touch: we are Neil Fantom, Chief Statistician, Kelly Clingham and Justine Joshua, Senior Statistical Assistants, and Courtney O’Dean, Statistics Assistant. You can find us in person at the Statistics Office on the top floor of the Post Office Building, Jamestown. You can also contact us by telephone on 22138; if calling from overseas, the international dialling code for St Helena is 290. Our general office e-mail address is statistics@sainthelena.gov.sh, or you can email team members directly (the format is firstname.lastname@sainthelena.gov.sh).

  • Statistical Update: Price Inflation

    Latest index value and inflation rates for Q2 2025

    The latest estimate of the Consumer Price Index (CPI) has been released by the St Helena Statistics Office, for the second quarter of 2025 (Q2 2025). The CPI has been measured at 103.6, a small increase of 0.1% on the previous quarter (Q1 2025) but a 6.3% increase compared to a year ago (Q2 2024). This annual inflation rate of 6.3% is a drop in the rate of 0.2 percentage points compared to the rate measured in Q1 2025, which was 6.5%.

    Price changes over the last year

    On average, all broad groups of items saw their prices rise compared to a year ago. The highest average annual increase was in Communication (18.4%), resulting from increases in July 2024 in the landline telephone tariff and the price of mobile data packages. There was an average annual increase in Household Energy of 14.5%, the result of the increase in the price of electricity in July 2024, and increases in the price of firewood and gas cylinder refills. The average annual increase in Food prices was 7.0%, which was slightly lower than the annual increase measured last quarter (8.4%).

    Price changes over the last quarter

    The quarterly change in the CPI was 0.1%, comparing Q2 2025 to Q1 2025. Only three groups of categories experienced average increases since the last quarter: Household Energy, 1.8%; Miscellaneous Good & Services, 0.9%; and Transport, 0.6%. Clothing, Food and Alcohol and Tobacco fell slightly and all other categories remained unchanged.

    In this quarter, the major prices changes that have affected the inflation rate were in locally-provided services (electricity and telecommunications), but price changes in both the UK and South Africa usually have a strong impact on prices on St Helena, since the majority of goods imported are purchased in those two countries. In May 2025 annual consumer price inflation in the UK was measured at 3.4% (UK Office for National Statistics), down from 3.5% in April. In South Africa, annual consumer price inflation was measured at 2.8% in May 2025 (Statistics South Africa), unchanged from April 2025. Changes in the value of the Rand compared to the Pound can have a large effect on the change in the price of goods purchased in South Africa, especially during periods of increase or decrease. However, for the period July 2024 to June 2025, the Pound averaged 23.5 Rand, which is very similar to the average value for the previous twelve months, which was 23.6, and so had no major impact on the St Helena inflation rate.

    Methodology

    Rebasing the Index

    The Index was rebased in the third quarter of 2024, following the 2023 Household Expenditure Survey (HES) and subsequent analysis by the Statistics Office. The HES reviewed the composition of the average ‘shopping basket’ of goods and services purchased by households on St Helena, to make sure it reflects current spending habits. The Statistics Office has also reviewed the items that are used to represent each category of spending in the basket, to make sure they are also up to date and relevant. The rebased Index includes 205 categories of expenditure, within nine broader groupings; these broader groupings are unchanged from the previous Index. Within the broad groupings, the detailed categories of expenditure have been adjusted slightly to better align with international guidelines, and in particular they now only include expenditure related to household consumption, and not all expenditures. This has also made a change to the terminology necessary: the Index has been renamed the Consumer Price Index (CPI), rather than the Retail Price Index (RPI).

    What is price inflation and how is it measured?

    Price inflation is the change in the average prices of goods and services over time. The rate of price inflation is calculated from the change in the CPI, which is the official measure of the average change in the prices of goods and services paid by consumers. The CPI is estimated each quarter, i.e. once every three months, and the rate of price inflation is usually quoted on an annual basis; that is, comparing price changes over a 12-month period. Prices and the CPI tend to go up, but they can occasionally go down – which is known as price deflation.

    The CPI is a statistical measure of the change in consumer prices on St Helena; an increase in the CPI means that, on average, prices have gone up since the last time they were measured, and a decrease in the CPI means that, on average, prices have fallen. The annual change in the CPI is called the annual inflation rate, and is the usual measure of the change in prices in an economy. The CPI is an average measure: if it goes up, it does not mean that all prices have gone up, and similarly, if it goes down, it does not mean that all prices have fallen.

    Why do we measure inflation?

    An accurate measure of price inflation helps understand the extent and nature of the impact of price changes on the government, businesses, households and individuals. Inflation rates are often used in budgeting and accounting processes so that costs can be adjusted for the effect of price changes.

    How is the CPI calculated?

    The basis for the CPI is the average weekly cost of goods and services purchased by households on St Helena for consumption, sometimes called the CPI ‘shopping basket’. Items which households purchase more of, such as food, have the biggest share of the CPI basket. The current CPI uses a basket from the latest Household Expenditure Survey in 2023; prices representing the groups of items in the basket are collected every quarter, and the price of the total basket is compared to the price in the baseline period, the third quarter of 2024. By convention, the value of the basket in the baseline period is scaled to 100, and the CPI values are quoted in relation to that baseline. For example, a CPI value of 120 means that average prices have increased by 20 per cent compared to those recorded in the baseline period.

    Composition of average household weekly expenditure (Q3 2024 CPI ‘Shopping Basket’)

    What happens when items are not available?

    If an item of the ‘basket’ is not available then either the previous price will be carried forward from the previous quarter, or a suitable substitute item will be identified and an adjustment calculation made. Care is taken to ensure that this substitute item represents the item category and that it does not introduce error to the measurement of the CPI. An important principle is that price changes should reflect actual price increases and decreases, and not changes in the quality of items.

    Where can I get the data?

    For detailed tables of the CPI and annual inflation rates from 1994 onwards, please visit: https://www.sainthelena.gov.sh/st-helena/statistics/the-economy and download the ‘inflation’ data file. Other datasets, bulletins and reports are also available on our website at www.sainthelena.gov.sh/statistics.

    Have more questions or comments?

    Please get in touch. We are Neil Fantom, Statistical Commissioner, Kelly Clingham and Justine Joshua, Senior Statistical Assistants and Courtney O’Dean, Statistics Assistant. You can find us in person at the Statistics Office on the top floor of the Post Office, Jamestown. You can also contact us by telephone on our direct line through 22138. If calling from overseas, the international dialling code for St Helena is +290. Our general office e-mail address is statistics@sainthelena.gov.sh, or you can email team members directly (the format is firstname.lastname@sainthelena.gov.sh).

  • Statistical Update: Arrivals and Departures

    The latest provisional estimates have been released for the numbers of passenger arrivals and departures to and from St Helena, up to the end of March 2025.

    Note: Estimates of the arrivals of St Helenians and those arriving for leisure are not yet available for November 2024 onwards, due to a change in immigration arrival procedures.

    Arrivals

    In March 2025, there were an estimated 549 arrivals, with 426 arriving by air; this compares with 314 arrivals in March 2024, with 267 arriving by air.

    https://datawrapper.dwcdn.net/EA4bJ/30/

    During the last 12 months (April 2024 to March 2025) there have been 5,008 arrivals, compared to 4,363 in the same period a year ago – a 14.8% increase.

    Departures

    In March 2025 there were an estimated 612 departures from the island, 63 more than the number of arrivals. During the last 12 months (April 2024 to March 2025), there were a total of 5,022 departures, compared to 4,433 in the same period a year ago – an increase of 13.3%.

    https://datawrapper.dwcdn.net/KlqTH/25/

    Get the data

    A file in Excel format with detailed monthly statistics on arrivals and departures to March 2025 can be downloaded here.

  • Statistical Update: Average Incomes from Full-time Employment, 2023/24

    This update releases new estimates of gross annual incomes of full-time employees (i.e. wages) for the 2023/24 financial year, with comparable estimates for previous years from 2013/14 onwards. To download the full dataset in Excel format, please click here.

    These estimates measure gross before-tax incomes of persons in regular full-time employment on St Helena, reported through the Pay-As-You-Earn tax collection system. They exclude company and self-employment incomes, incomes of Technical Cooperation (TC) Officers of the St Helena Government, investment income, Income Related Benefits, incomes from pensions (including the Basic Island Pension), and part-time and part-year incomes, all as far as they can be identified in the dataset. All annual estimates are rounded to the nearest £10.

    Median wage levels, adjusted for inflation

    The median annual wage on St Helena in 2023/24 is estimated to be £10,490, in 2023/24 prices. When price inflation is taken into account, this is 3.8% higher than the median wage in 2022/23 (Chart 1).

    Chart 1. Annual gross wages from full-time employment: median and upper and lower quartiles, 2013/14 to 2023/24 (inflation-adjusted 2023/24 prices)

    The median is the usual measure of average incomes or wages because it is less sensitive to small numbers of relatively high wage earners in a population than the mean, which is the more common method used in other statistics. A median wage level of £10,490 means that, for 2023/24, half the people earning full-time wages from non-TC employment had gross wages that were less than £10,490, and half had gross wages that were higher.

    Wage level range

    Chart 1 also shows the upper and lower quartiles; the lower quartile is the point at which a quarter of wages are lower, and the upper quartile is the point at which a quarter of wages are higher; half of all employment wages lie between the lower and upper quartiles. For 2023/24 half of all full-time employees earned between £8,490 and £13,940. The gap between the upper and lower quartiles is smaller in 2023/24 than in 2013/14 and 2014/15, likely the result of a number of relatively higher paid workers leaving the workforce when St Helena’s Airport was completed in 2016 and 2017.

    Median incomes are also reported for each decile in the dataset; each decile includes one tenth of all incomes, from the lowest to the highest. It is notable that the median incomes of all deciles increased by at least 3% when inflation is taken into account, apart from the top two deciles (i.e. the highest earners), which both decreased by around 1%.

    Differences in wage levels between women and men

    Chart 2 shows inflation-adjusted median wages from employment broken down by male and female employees, between 2013/14 and 2023/24. For every year, the male median wage has been higher than the female median wage, but the gap between the two has narrowed in recent years, and has almost disappeared in 2022/23 and 2023/24. In part this is also due to the completion of the new Airport; construction workers employed were predominantly male, relatively higher paid, and many of them have since either left St Helena or found alternative lower paid employment.

    Chart 2. Median real gross annual wages from employment, male and female 2013/14 to 2023/24, in constant 2023/24 prices (i.e. adjusted for inflation)

    Average wage levels by occupation

    Employees have been classified into their main occupational grouping using the International Standard Classification of Occupations published by the United Nations (International Labour Organisation). Chart 3 shows estimates of median wages in each of these major groupings, for 2023/24, excluding TC Officers and 17 persons that could not be classified by occupation.

    The groups of occupations with the highest wages, on average, were Managers, Professionals, and Technicians and Associate Professionals. These groups accounted for 499 employees, or 31% of non-TC employees. The occupations with the lowest wages, on average, were Skilled Agricultural, Forestry and Fishery Workers, Services and Sales Workers, and Elementary Occupations (this group includes unskilled labourers). These groups accounted for 691 employees, or 43% of non-TC Officers.

    Chart 3. Median gross annual wages from employment by occupational grouping, 2023/24

    Average wage levels by industry

    Employees have also been classified into their main industry grouping using the International Standard Industrial Classification published by the United Nations. Industries differ from occupations, since they indicate the principle economic activity to which each employee contributes; mainly, the classification by industry derives from employers. Chart 4 shows estimates of median wages in each major grouping, for non-TC employees, and excluding 14 persons that could not be classified.

    In 2023/24 the groups of industries with the highest wages, on average, were Finance, Insurance, Information, Communication and Real Estate, Transportation and Storage, and Public Administration. The industries with the lowest wages, on average, were Professional, Scientific, Technical, Administrative and Support Service Activities, Accommodation and Food Service Activities, and Agriculture, Forestry, and Fishing.

    Chart 4. Median gross annual wages from employment by industry, 2023/24

    Numbers of persons in full-time employment

    Chart 5 shows the number of persons with wages from full-time employment above and below the income tax allowance, excluding TC officers. Personal income below the income tax allowance is not subject to income tax.

    The total estimated number of persons with wages from full-time employment rose to 1,949 in 2017/18, the year when the new airport was opened and most construction activities were completed. Since then, the number has tended to fall slightly each year; in 2021/22, there were an estimated 1,668 persons with wages from full-time employment, and in 2023/24 this is estimated to be 1,596.

    Even though the total number of full time employees has declined in the last few years, the number of full-time employees above the income tax allowance of £7,000 increased slightly in 2023/24, to 1,491. The number of people earning more than the minimum wage but not earning enough to pay income tax fell to 105 in 2023/24.

    Chart 5. Number of employees in full-time employment, 2013/14 to 2023/24

    Get the data

    The complete set of statistics on average gross incomes from employment from 2013/14 to 2023/24 is available here. For more statistical data on the St Helena Economy, see sainthelena.gov.sh/statistics.

    Methodology

    Data source. Statistics on wages and incomes on St Helena are derived from a computerised database maintained by the Income Tax Office, which captures information about all wage earners whose details are submitted through the Pay-As-You-Earn (PAYE) system. There are some limitations when using this database as a source for estimating incomes; for example, informal income earned may not be declared; it is difficult to distinguish full-time and part-time workers and full-year and part-year incomes; and a small number of reported incomes may include second jobs or other sources of income.

    Gross income (wages) from employment. The primary analysis in this Bulletin uses average gross incomes from employment, also referred to as wages. Income from investments (including employer pension schemes) and from self-employment, benefits, or the Basic Island Pension is excluded, as far as they can be identified. Incomes are gross, that is, before any tax is deducted, and all published estimates are rounded to the nearest £10 (calculations of constant price estimates are made on the unrounded estimates and growth rate calculations are made using the rounded estimates). Only incomes that are high enough to represent full-time employment from a 32.5 hour working week are included; this is a slight change in methodology, and has been reduced from 35 hours to ensure all incomes resulting from roughly 35 hours of work per week are included.

    Median. The median is a measure of the average value of a set of numbers. It is the ‘middle number’ in a ranked list, the value at which exactly half the population has a smaller value and half has a higher value. It is preferred to the mean when estimating average incomes or wages, since it is less easily ‘skewed’ by a few individuals with relatively large incomes.

    Mean. The mean is a measure of the average value of a set of numbers; it is derived by adding all the numbers together, and dividing by the number of values in the dataset. While it is the most common measure of the average for many applications, it can produce misleading results for estimating average incomes because it can be biased by small numbers of relatively high incomes.

    Adjusting for inflation. Most of the average income estimates are adjusted for the impact of price inflation, using St Helena’s Retail Price Index to estimate relevant statistics in 2023/24 prices. Inflation-adjusted estimates are called ‘constant’ or ‘real’; unadjusted estimates are called ‘nominal’ or ‘current’. Inflation-adjustment makes comparisons over time more meaningful, since any change up or down shows whether a person has more or less purchasing power. For example, the median nominal gross income for 2013/14 was £7,780 per year. But prices were not the same in 2023/24 as they were in 2013/14; an employee would need to have earned £10,300 a year to buy the same amount of goods and services in 2023/24 that they could buy in 2013/14 with £7,780. So £10,300 is the average gross income in 2013/14 stated in 2023/24 prices.

    Eliminating part-year and part-time incomes. A lower bound threshold is set to try to ensure that part-time or under-reported incomes are excluded from the analysis as far as possible; the threshold is set using the Minimum Wage for a 32.5 hour week (this is a slight change, from the previous threshold which used 35 hours). Incomes that were assessed for income tax using an allowance of half a year or less have also been excluded.

    Exclusion of Technical Cooperation Officers from the analysis. Technical Cooperation Officers are persons employed by St Helena Government following international recruitment as a result of limited labour availability in particular occupations on the Island; in 2023/24, 92% of them were Managers, Professionals, Associate Professionals, or Technicians, and 95% of them worked in Public Administration (which includes the Police and various legal professions), Human Health and Social Work (which includes Doctors and Nurses), and Education (which includes Teachers). They are employed for a fixed period of time on internationally competitive pay scales and terms and conditions which differ from those recruited locally on St Helena. As such, their incomes are not typical and so are excluded from the main statistics on incomes.

    Contact us and find out more

    The team at the Statistics Office currently comprises Neil Fantom, Statistical Commissioner, Kelly Clingham and Justine Joshua, Senior Statistical Assistants, and Courtney O’Dean, Statistics Assistant. Please visit us in person; the Statistics Office is on the second floor of the Post Office, Jamestown. Call by, we would love to see you! You can also contact us by telephone: our direct line is 22138. If calling from overseas, the international dialling code for St Helena is +290. Our general office email address is: statistics@sainthelena.gov.sh, or you can email team members directly (the format is firstname.lastname@sainthelena.gov.sh).

    For more statistical data and reports, covering many aspects of St Helena’s social and economic development, please visit us on the web: www.sainthelena.gov.sh/st-helena/statistics.

  • Statistical Update: Arrivals and Departures

    The latest provisional estimates have been released for the numbers of passenger arrivals and departures to and from St Helena, up to the end of February 2025.

    Note: Estimates of the arrivals of St Helenians and those arriving for leisure are not yet available for November 2024 onwards, due to a change in immigration arrival procedures.

    Arrivals

    In February 2025, there were an estimated 656 arrivals, with 480 arriving by air; this compares with 458 arrivals in February 2024, with 343 arriving by air.

    https://datawrapper.dwcdn.net/EA4bJ/30/

    During the last 12 months (March 2024 to February 2025) there have been 4,774 arrivals, compared to 4,426 in the same period a year ago – a 7.9% increase.

    Departures

    In February 2025 there were an estimated 663 departures from the island, 7 more than the number of arrivals. During the last 12 months (March 2024 to February 2025), there were a total of 4,779 departures, compared to 4,451 in the same period a year ago – an increase of 7.4%.

    https://datawrapper.dwcdn.net/KlqTH/23/

    Get the data

    A file in Excel format with detailed monthly statistics on arrivals and departures to February 2025 can be downloaded here.

  • Statistical Update: Price Inflation

    Latest index value and inflation rates for Q1 2025

    The latest estimate of the Consumer Price Index (CPI) has been released by the St Helena Statistics Office, for the first quarter of 2025 (Q1 2025). The CPI has been measured at 103.5, a small increase of 0.4% on the previous quarter (Q4 2024) but a 6.5% increase compared to a year ago (Q1 2024). This annual inflation rate of 6.5% is a drop in the rate of 1.7 percentage points compared to the rate measured in Q4 2024, which was 8.2%.

    Price changes over the last year

    On average, all broad groups of items saw their prices rise compared to a year ago, except for clothing. The highest average annual increase was in Communication (18.4%), resulting from increases in July 2024 in the landline telephone tariff and mobile data packages. There was an average annual increase in Household Energy of 12.5%, lower than in the previous quarter (28.1%) and the result of the increase in the price of electricity in July 2024. The average annual increase in Food prices was 8.4%, which was also slightly lower than the annual increase measured last quarter (9.7%), and still includes the increase in the price of locally produced bread and meat implemented by Solomons in Q4 2024. Transport costs increased by 5.2% on average over the year, partly because of the increase in the price of the public transport service in December 2024.

    Price changes over the last quarter

    The quarterly change in the CPI was 0.4%, comparing Q1 2025 to Q4 2024. Only three groups of categories experienced average increases since the last quarter: Alcohol & Tobacco, 2.1%; Miscellaneous Good & Services, 0.7%; and Food, 0.5%. Household Goods and Services fell slightly (-0.4%), with all other catergories being unchanged on average.

    Note that normally price changes in both the UK and South Africa have a strong impact on prices on St Helena, since the majority of goods imported are purchased in those two countries (although for the Q4 2024 Index, price increases in local goods and services had a major effect). In March 2025 annual consumer price inflation in the UK was measured at 2.6% (UK Office for National Statistics), down from 2.8% in February. In South Africa, annual consumer price inflation was measured at 3.2% in February 2025 (Statistics South Africa), unchanged from January 2025. Changes in the value of the Rand compared to the Pound can have a large effect on the change in the price of goods purchased in South Africa, especially during periods of increase or decrease. However, for the period April 2024 to March 2025, the Pound averaged 23.3 Rand, which is very similar to the average value for the previous twelve months, which was 23.5, and so had no major impact on the St Helena inflation rate.

    Methodology

    Rebasing the Index

    The Index was rebased in the third quarter of 2024, following the 2023 Household Expenditure Survey (HES) and subsequent analysis by the Statistics Office. The HES reviewed the composition of the average ‘shopping basket’ of goods and services purchased by households on St Helena, to make sure it reflects current spending habits. The Statistics Office has also reviewed the items that are used to represent each category of spending in the basket, to make sure they are also up to date and relevant. The rebased Index includes 205 categories of expenditure, within nine broader groupings; these broader groupings are unchanged from the previous Index. Within the broad groupings, the detailed categories of expenditure have been adjusted slightly to better align with international guidelines, and in particular they now only include expenditure related to household consumption, and not all expenditures. This has also made a change to the terminology necessary: the Index has been renamed the Consumer Price Index (CPI), rather than the Retail Price Index (RPI).

    What is price inflation and how is it measured?

    Price inflation is the change in the average prices of goods and services over time. The rate of price inflation is calculated from the change in the CPI, which is the official measure of the average change in the prices of goods and services paid by consumers. The CPI is estimated each quarter, i.e. once every three months, and the rate of price inflation is usually quoted on an annual basis; that is, comparing price changes over a 12-month period. Prices and the CPI tend to go up, but they can occasionally go down – which is known as price deflation.

    The CPI is a statistical measure of the change in consumer prices on St Helena; an increase in the CPI means that, on average, prices have gone up since the last time they were measured, and a decrease in the CPI means that, on average, prices have fallen. The annual change in the CPI is called the annual inflation rate, and is the usual measure of the change in prices in an economy. The CPI is an average measure: if it goes up, it does not mean that all prices have gone up, and similarly, if it goes down, it does not mean that all prices have fallen.

    Why do we measure inflation?

    An accurate measure of price inflation helps understand the extent and nature of the impact of price changes on the government, businesses, households and individuals. Inflation rates are often used in budgeting and accounting processes so that costs can be adjusted for the effect of price changes.

    How is the CPI calculated?

    The basis for the CPI is the average weekly cost of goods and services purchased by households on St Helena for consumption, sometimes called the CPI ‘shopping basket’. Items which households purchase more of, such as food, have the biggest share of the CPI basket. The current CPI uses a basket from the latest Household Expenditure Survey in 2023; prices representing the groups of items in the basket are collected every quarter, and the price of the total basket is compared to the price in the baseline period, the third quarter of 2024. By convention, the value of the basket in the baseline period is scaled to 100, and the CPI values are quoted in relation to that baseline. For example, a CPI value of 120 means that average prices have increased by 20 per cent compared to those recorded in the baseline period.

    Composition of average household weekly expenditure (Q3 2024 CPI ‘Shopping Basket’)

    What happens when items are not available?

    If an item of the ‘basket’ is not available then either the previous price will be carried forward from the previous quarter, or a suitable substitute item will be identified and an adjustment calculation made. Care is taken to ensure that this substitute item represents the item category and that it does not introduce error to the measurement of the CPI. An important principle is that price changes should reflect actual price increases and decreases, and not changes in the quality of items.

    Where can I get the data?

    For detailed tables of the CPI and annual inflation rates from 1994 onwards, please visit: https://www.sainthelena.gov.sh/st-helena/statistics/the-economy and download the ‘inflation’ data file. Other datasets, bulletins and reports are also available on our website at www.sainthelena.gov.sh/statistics.

    Have more questions or comments?

    Please get in touch. We are Neil Fantom, Statistical Commissioner, Kelly Clingham and Justine Joshua, Senior Statistical Assistants and Courtney O’Dean, Statistics Assistant. You can find us in person at the Statistics Office on the top floor of the Post Office, Jamestown. You can also contact us by telephone on our direct line through 22138. If calling from overseas, the international dialling code for St Helena is +290. Our general office e-mail address is statistics@sainthelena.gov.sh, or you can email team members directly (the format is firstname.lastname@sainthelena.gov.sh).

  • Statistical Update: Arrivals and Departures

    The latest provisional estimates have been released for the numbers of passenger arrivals and departures to and from St Helena, up to the end of January 2025.

    Note: this release was updated on April 15 2025; estimates of the arrivals of St Helenians and those arriving for leisure are not yet available for November 2024 onwards, due to a change in immigration arrival procedures.

    Arrivals

    In January 2025, there were an estimated 756 arrivals, with 519 arriving by air; this compares with 625 arrivals in January 2024, with 449 arriving by air.

    https://datawrapper.dwcdn.net/EA4bJ/29/

    During the last 12 months (February 2024 to January 2025) there have been 4,576 arrivals, compared to 4,361 in the same period a year ago – a 4.9% increase.

    Departures

    In January 2025 there were an estimated 974 departures from the island, 218 more than the number of arrivals. During the last 12 months (February 2024 to January 2025), there were a total of 4,623 departures, compared to 4,385 in the same period a year ago – an increase of 5.4%.

    https://datawrapper.dwcdn.net/KlqTH/23/

    Get the data

    A file in Excel format with detailed monthly statistics on arrivals and departures to January 2025 can be downloaded here.