We welcome comments and suggestions on any of the statistics published by the Statistics Office. Please email: statistics@sainthelena.gov.sh, call tel: 22138, or visit the office in person on the first floor of the Castle, Jamestown.
The Statistics Office has released new estimates of average incomes from full-time employment for the 2019/20 financial year.
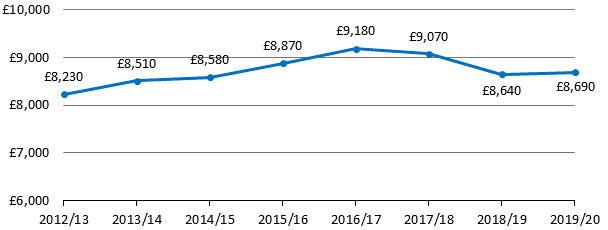
The estimated median annual before-tax wage rose to £8,690 – a modest increase of 0.6% compared to the previous year when price inflation is taken into account. This is a change to the trend in the previous two years, when median wages fell. The median wage level however is around 5% lower than in 2016/17, after adjusting for inflation.
Chart 1. Median annual gross wages from full-time employment, 2012/13 to 2019/20, in constant 2019/20 prices (i.e. adjusted for price inflation)
The median is the usual measure of average incomes or wages, because it is less sensitive than the mean (the more common method used in other statistics) to small numbers of relatively high wage earners in a population. A median wage level of £8,690 means that, for 2019/20, half of before-tax wages from locally-recruited employment were less than £8,690, and half were higher.
The estimates are derived from records maintained by the Income Tax Office using methodology consistent with previous releases. Only incomes from employment above an analysis cut-off (set around the level of a single-person Income Related Benefit) are included; any income from self-employment and investment is excluded. Incomes of persons employed by the St Helena Government following international recruitment (known as Technical Cooperation Officers) are not considered typical and so are also excluded from the statistics on incomes.
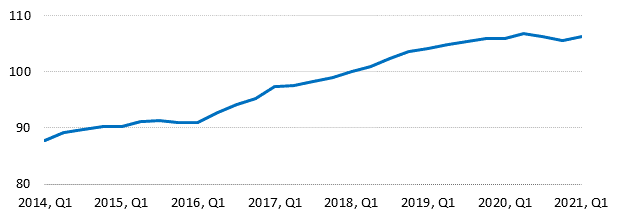
For the first quarter of 2021 the Retail Price Index (RPI) has been measured at 106.3. This is a small increase from a year ago, when the RPI was 105.9. This means that the annual inflation rate is 0.4%, comparing prices now to the same time period in 2020. Last quarter, the index stood at 105.6.
Chart 1. St Helena Retail Price Index Q1 2014 to Q1 2021 (Q1 2018=100)
The 0.4% annual inflation rate is a combined result of the low inflation rates in both the UK and South Africa and the impact of the value of the South African Rand compared to the St Helena Pound over the last 12 months. Inflation in the United Kingdom was measured at 0.4% for February 2021 (Office for National Statistics), inflation in South Africa was measured at 2.9% during the same period (Statistics South Africa). The Rand has strengthened slightly against the Pound over the year, contributing to the price change in some items bought from South Africa. Freight costs and rates of customs duties for certain items also have an impact on shelf prices along with the impact of the COVID-19 pandemic which has been a contributing factor, limiting some suppliers’ operations and the demand for goods and services.
Notable increases in prices over the year include items in the alcohol and tobacco category and the clothing category. Notable decreases in annual prices included the price of fuel; petrol fell from £1.37 to £1.28 per litre, and diesel from £1.46 to £1.35 a litre.
We welcome comments and suggestions on any of the statistics published by the Statistics Office. Please email: statistics@sainthelena.gov.sh, call tel: 22138, or visit the office in person on the first floor of the Castle, Jamestown.
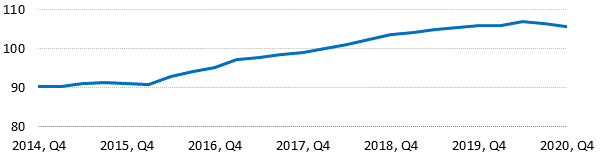
For the fourth quarter of 2020, the Retail Price Index (RPI) has been measured at 105.6. This is a very slight decrease from a year ago, when the RPI was 105.9. This means that the average annual inflation rate is -0.2%, comparing prices now to the same period in 2019. Last quarter, the annual inflation rate stood at 1.0%.
Chart 1. St Helena Retail Price Index Q4 2014 to Q4 2020 (Q1 2018=100)
The major factor that is contributing to the low annual inflation rate on St Helena continues to be the strength of the Pound compared to the South African Rand, and the low inflation rates in both the United Kingdom and South Africa, where most of the goods that are imported to St Helena are purchased.
The largest annual increase in average prices was in the Alcohol and Tobacco category (7.4%). As in the previous quarter, this is due to increases in Customs duties during the year (duty on alcohol was increased by 2.9% and on tobacco and tobacco products by 3.9%).
Average prices of goods and services fell over the year in four categories: Household Energy, Miscellaneous Goods and Services, Food, and Transport. The 0.8% fall in average food prices is especially significant, because Food comprises more than a third of the overall basket. As explained previously, this is largely a result of the lower value of the Rand compared to the St Helena Pound; some South African food items, such as UHT milk, dropped in price as a result, compared to a year ago. The fall in the Transport category is largely due to a decrease in the price of both petrol and diesel; in Q4 2019, a year ago, petrol cost £1.37 a litre and diesel cost £1.46 a litre. But in Q4 2020, petrol cost £1.29 a litre and diesel cost £1.31 a litre.
We welcome comments and suggestions on any of the statistics published by the Statistics Office. Please email: statistics@sainthelena.gov.sh, call tel: 22138, or visit the office in person on the first floor of the Castle, Jamestown.
We welcome comments and suggestions on any of the statistics published by the Statistics Office. Please email: statistics@sainthelena.gov.sh, call tel: 22138, or visit the office in person on the first floor of the Castle, Jamestown.
The Statistics Office has published an update to the classification of countries based on their 14-day cumulative COVID-19 case prevalence rates and England quarantine status: please download the file here.
We welcome comments and suggestions on any of the statistics published by the Statistics Office. Please email: statistics@sainthelena.gov.sh, call tel: 22138, or visit the office in person on the first floor of the Castle, Jamestown.