hamzaupwork.com

Category: Statistics

  • STATISTICS UPDATE: EXTERNAL TRADE (IMPORTS AND EXPORTS)

    A statistical update on external trade has been released on December 13, 2018, including new estimates of the value of imports and exports of goods and services for the 2017/18 financial year, and estimates of the quantity of fish by species up to the second quarter, 2018.

    Additional statistical series and indicators are available at  https://www.sainthelena.gov.sh/statistics-data, and published statistical reports, including Statistical Bulletins, can be found on the statistics reports and publications page of the SHG website: https://www.sainthelena.gov.sh/statistics-reports-and-publications.

    We welcome comments and suggestions on any of the statistics published by the Statistics Office. Please email: statistics@sainthelena.gov.sh, tel: 22138, or visit the office in person on the second floor of the Castle, Jamestown.

  • STATISTICAL BULLETIN NO. 11, 2018 – WAGES

    The eleventh Statistical Bulletin of 2018 releases new estimates of gross incomes from employment for the 2017/18 financial year, together with small revisions to estimates for previous years. The data in this Bulletin are derived from records maintained by the Income Tax Office primarily from the Pay-As-You-Earn (PAYE) system. The methodology used is consistent with previous estimates for 2011/12 to 2016/17. An improvement in this release is that most of the average income estimates are adjusted for the impact of price inflation, using constant 2017/18 prices, rather that the nominal figures used in previous Bulletins.

    When price inflation is taken into account, the average income on St Helena fell slightly in 2017/18 compared to the previous year by 0.7%. However, the lowest earners and female workers have experienced a small average increase in income, whilst the highest income earners and male workers have experienced a small average decrease in income.

    The pdf version of the full Bulletin can be found here.

    Average gross employee income

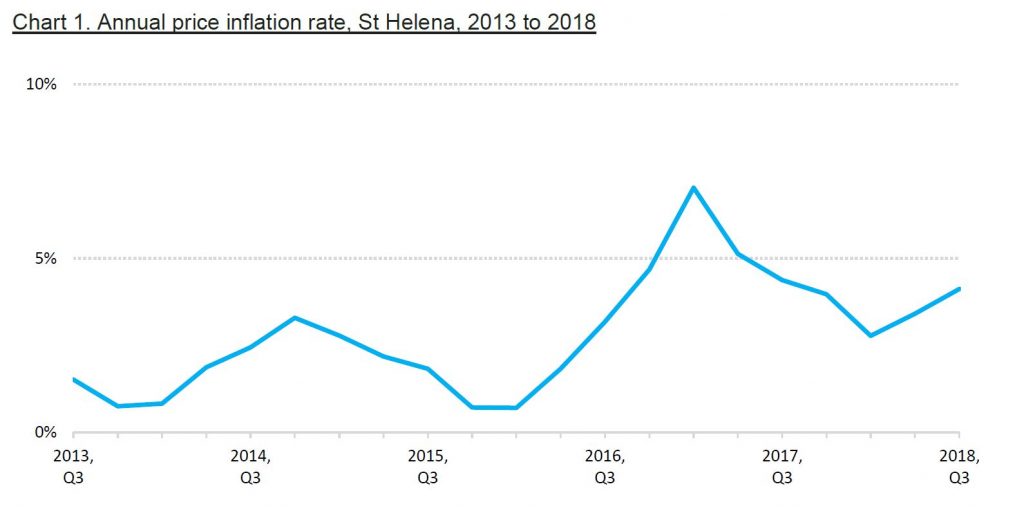
    The average annual gross income from full-time employment on St Helena in 2017/18, measured using the median, was £8,500 per employee. This is a nominal increase of 3.3% compared to the previous year. But since retail prices rose faster than this, by 4.1% in 2017/18 on average, the average gross income from employment fell slightly in real terms by 0.7% when inflation is taken into account. This is the first fall in the real levels of average incomes from employment for at least the last five years (Chart 1), when the annual “real” rise in average incomes from employment was 2.7% on average. Despite the slight fall in average income compared to 2016/17, the real average income for 2017/18 was still 2.5% greater than the average income for the year 2015/16.

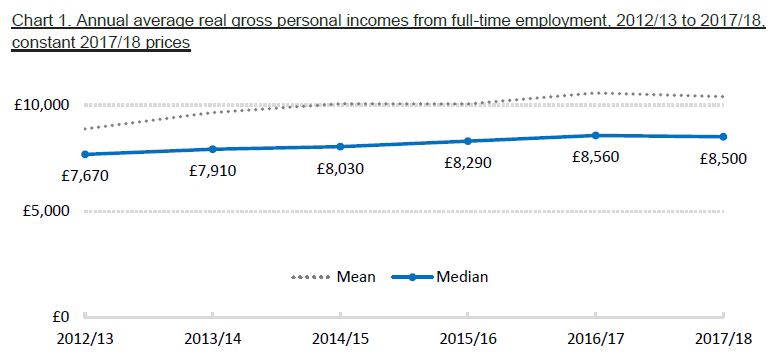
    Note that the median is the usual measure of average incomes: it is the level at which half of those above it earn more, and half earn less – so for 2017/18 half of gross employment incomes were less than £8,500, and half were higher. The median is used because it is less sensitive to small numbers of high incomes than the mean; the mean tends to overstate the average for this reason (Chart 1).

    Chart 2 shows the upper and lower quartiles; the lower quartile is the point at which a quarter of incomes are lower, and the upper quartile is the point at which a quarter if incomes are higher. Half of all incomes from employment lie between the lower and upper quartiles, so for 2017/18 half of all full-time employees earned between £6,700 and £11,680. This chart also shows incomes adjusted for inflation; it is interesting to note that the upper quartile for 2017/18 is lower, in real terms, than the upper quartile in 2014/15, whilst the lower quartile is at the highest for six years. This shows that the lowest incomes have increased, whilst the highest incomes have reduced.

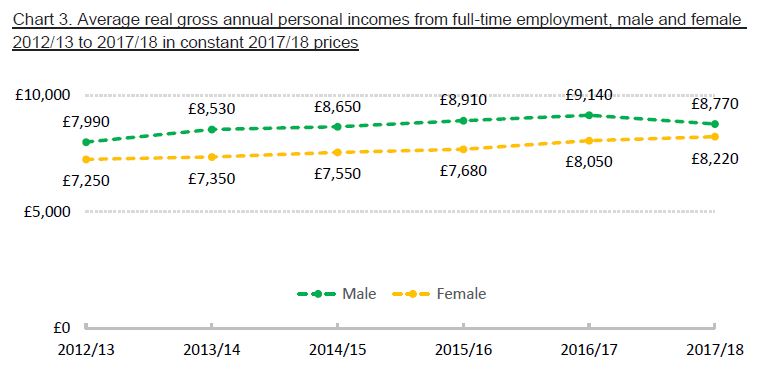
    Chart 3 shows real incomes from employment broken down by male and female. From 2012/13 to 2017/18, male incomes were higher than female on average. The gap between the two grew in 2013/14, remained the same until 2016/17, but it narrowed in 2016/17 as male incomes fell faster than the average while female real incomes continued to rise. This may be the effect of completion of the construction of the Airport, since workers were predominantly male and many of them left St Helena or found alternative employment during 2016/17 and 2017/18.

    As in previous statistical releases on income, these estimates measure pre-tax (gross) incomes of the persons in full-time regular employment on St Helena above an analysis threshold. They exclude company and self-employment incomes, incomes of Technical Cooperation Officers, and investment income. For each year, the analysis threshold is set at a level around the single-person rate of the Minimum Income Standard (less housing rent), a measure of poverty – this helps eliminate part-time incomes, incomes derived purely from benefits, and incomes that are under reported. Unless otherwise stated, all estimates of personal incomes in this bulletin use these thresholds. All annual estimates are rounded to the nearest 10.

    Distribution of incomes from employment

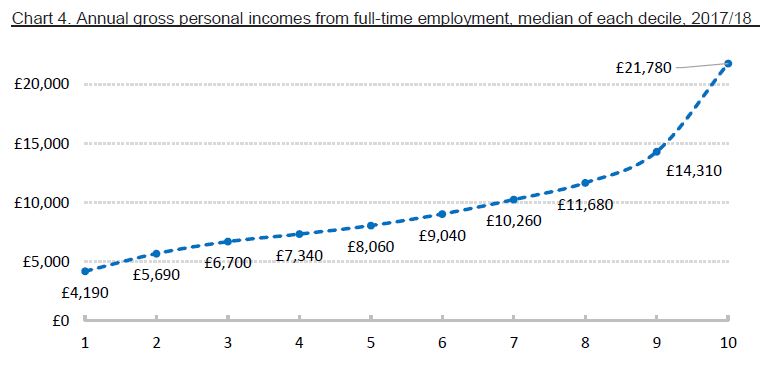
    Chart 4 illustrates the distribution of personal incomes from full-time employment in 2017/18. As in 2016/17, there is less than £4,000 between the medians of the first five deciles – the half of the population with the lowest incomes, and, in contrast, the medians of the half of the population with the highest incomes have a much broader spread of over £12,000.

    The minimum wage and the income tax threshold

    St Helena operates a minimum wage policy, and St Helena’s income tax system also operates a minimum threshold before any tax is due; this taxable income threshold remained constant at £7,000 per person per year for the financial years 2011/12 to 2016/17, although the minimum wage has changed: from £2.30 to £2.60 an hour in July 2015, then from £2.60 to £2.95 an hour in July 2017, and from £2.95 to £3.05 an hour in August 2018 for employees over the age of 18. Chart 5 shows the number of persons earning income from full-time employment that were above the minimum wage and the income tax threshold.

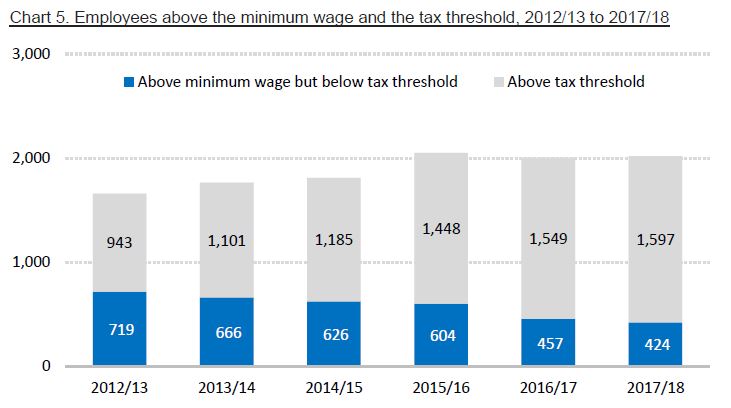
    The number of employees above the fixed income tax threshold of £7,000 has been increasing each year; for instance there were 660 extra people paying income tax as a result of employment income in 2017/18 compared to 2012/13. The total number of employees above the minimum wage has been fairly stable (around 2,000) over the last three years.

    Get the data

    The complete set of statistics on average gross incomes from employment from 2012/13 to 2017/18 are available at www.sainthelena.gov.sh/statistics/data.

    Methodology

    Data source. Statistics on incomes on St Helena are derived from a computerised database maintained by the Income Tax Office. This captures information about all income-earners whose details are submitted through the Pay-As-You-Earn (PAYE) system and through individual and corporate tax returns. There are some limitations when using this database as a source for estimating incomes; for example, informal income earned may not be declared, and it is difficult to distinguish full-time and part-time workers.

    Gross income from employment. The primary analysis in this Bulletin uses average gross incomes from full-time employment. Income from investments and from self-employment is excluded. Incomes are gross, i.e. before any tax is deducted, and all estimates are rounded to the nearest 10.

    Median. The median is a measure of the average value of a set of numbers. It is the ‘middle number’ in a ranked list, the value at which exactly half the population has a smaller value and half has a higher value. It is preferred to the mean when estimating average incomes or wages, since it is less easily ‘skewed’ by individuals with relatively large incomes.

    Mean. The mean is a measure of the average value of a set of numbers; it is derived by adding all the numbers together, and dividing by the number of values in the dataset. While it is the most common measure of the average for many applications, it can produce misleading results for estimating average incomes because it can be biased by small numbers of relatively high incomes.

    Inflation adjustment. An important improvement in this release is that most of the average income estimates are adjusted for the impact of price inflation, using St Helena’s Retail Price Index. This is done by quoting “real” estimates in constant 2017/18 prices, rather that the nominal figures used in previous releases. This makes comparisons over time more meaningful, since any change up or down shows whether a person has more or less purchasing power. For example, the average nominal gross income for 2012/13 was £6,720 per year. But prices were not the same in 2017/18 compared to 2012/13 – they increased, on the whole. Using the Retail Price Index to make the calculation, an employee would need to have earned £7,770 a year to buy the same amount of goods and services in 2017/18 that they could buy in 2012/13 with £6,720. So £7,770 is the average gross income in 2012/13, in 2017/18 prices.

    Analysis threshold. Statistics on average gross incomes use a lower bound threshold to ensure that part-time or under-reported incomes, and incomes derived entirely from social benefits rather than employment, are excluded from the analysis as far as possible. The threshold is set slightly above the Minimum Income Standard level (less housing rent) for a single adult, a measure of poverty.

    Technical Cooperation Officers. Technical Cooperation Officers are persons employed by the Government of St Helena following international recruitment as a result of limited particular labour availability on St Helena. They are employed for a fixed period of time on internationally competitive pay scales and terms and conditions which differ from those recruited locally on St Helena. As such, their incomes are not considered typical and so are excluded from the main statistics on incomes.

  • STATISTICS UPDATE: POPULATION, ASCENSION POPULATION, PRODUCTION, BENEFITS AND EXCHANGE RATES

    Several statistical updates have been released on November 22, 2018 as follows:

    Additional statistical series and indicators are available at  https://www.sainthelena.gov.sh/statistics-data, and published statistical reports, including Statistical Bulletins, can be found on the statistics reports and publications page of the SHG website: https://www.sainthelena.gov.sh/statistics-reports-and-publications.

    We welcome comments and suggestions on any of the statistics published by the Statistics Office. Please email: statistics@sainthelena.gov.sh, call tel: 22138, or visit the office in person on the second floor of the Castle, Jamestown.

  • STATISTICS UPDATE: 2016 POPULATION CENSUS – OCCUPATIONS

    The data file from the 2016 Population Census has been updated with the occupations of those resident household members that were economically active at the time of the census, by gender and by nationality. Census 2016 Data.

    Additional statistical series and indicators are available on the Statistics Data page, and published statistical reports, including Statistical Bulletins, can be found on the Statistics Reports and Publications page.

    We welcome comments and suggestions on any of the statistics published by the Statistics Office. Please email: statistics@sainthelena.gov.sh, call tel: 22138, or visit the office in person on the second floor of the Castle, Jamestown.

  • STATISTICAL BULLETIN NO. 10, 2018

    In this bulletin: estimates of arrivals, departures, and the total population

    The focus of this Statistical Bulletin is arrivals and departures to and from St Helena, especially by air; St Helena’s first regular scheduled air service began more than a year ago on October 14, 2017.

    The primary source for the statistics in this release are records collected by the Immigration Office of the Police Directorate for arrivals and departures, and the Customer Service Centre at the Post Office for births and deaths. A full set of statistics and indicators can be downloaded in Excel format from the ‘Population’ file on the St Helena Statistics website at: www.sainthelena.gov.sh/statistics-data.

    Total arrivals

    People arrive on St Helena either by ship, by yacht, and – since the construction of St Helena’s airport in 2016 – by air (note that day visitors from cruise ships are not included in statistics on passenger arrivals, although they are included in Table 1 for completeness). For the one year period October 2017 to September 2018, excluding cruise ship passengers, 5,235 people arrived at St Helena altogether. This is a record number of arrivals in recent times; the next highest number since 2010 was 4,205 in 2014/15, for the same October to September period.

    Until 2018, most arrivals by sea have been by ship, on the RMS St Helena (following withdrawal of the RMS St Helena from service in February 2018, most arrivals by sea are by yacht). Chart 2 compares the average monthly arrivals on the RMS St Helena between 2010 and 2017 with monthly arrivals by air over the past year. Apart from the first three months of the new commercial air service, when the RMS St Helena was also still in service, arrivals by air have been higher. There is a clear seasonal pattern of arrivals around the Christmas months of December and January, but it is less pronounced for air arrivals compared to arrivals by the RMS St Helena.

    Purpose of visit of arrivals by air

    The purpose of visit of all persons arriving on St Helena has been classified as either returning resident, business, tourism/holiday, or in transit. Within tourism/holiday, there are two groups: St Helenians who usually live abroad but who return for short periods typically to visit family and friends, and other nationalities (i.e. non-St Helenians).

    Around half of all arrivals by air were for tourism or holiday (1,650 people or 49%) and just under half were arrivals of returning residents or those coming for business or employment (1,538, or 46%). It should be noted that these figures do not include a full year of commercial air operations because the service started in the middle of October; for a full year (365 days) of commercial flights, the first two flights of October 2018 would need to be added.

    Chart 4 illustrates arrivals by air by month; the typical seasonal pattern of non-St Helenian tourists is quite pronounced, but the pattern of St Helenians arriving for holiday visits over the past year by air has been quite different, with the most popular month being July. This coincides with the UK summer holiday season, but it is also likely that many St Helenians abroad chose to use the RMS St Helena over the 17/18 Christmas period, while the service was still operating.

    Length of stay of tourist/holiday visitors arriving by air

    The average length of stay has been calculated for those arriving by air for tourism or holiday purposes, and with a stay of less than six months. Only those visitors that have left are included; this helps exclude those that might arrive initially for a short period for a holiday, but who stay for much longer.

    Overall, during the first year of commercial air operations, most tourist/holiday visitors stayed for about a week (Chart 5). But there are differences between St Helenians and non-St Helenians: St Helenians stay much longer than other nationalities. Over 70% of non-St Helenian tourists stayed for a week or less, with less than 10% staying for a month or more. But 75% of St Helenians visiting on holiday stayed longer, with less than 10% staying for a week or less.

    Another measure is the total number of nights spent by the different groups of visitors, calculated by adding together the length of stay of each visitor that left. St Helenians visiting on holiday and arriving by air spent just under 17,000 nights in total on St Helena between October 2017 and September 2018, compared to just over 9,000 nights in total by non-St Helenian tourists – even though there were more arrivals of non-St Helenian tourists. This is because St Helenian visitors stayed longer, on average. From the total nights spent, it is possible to derive an average for the number of people on St Helena each night, by dividing by the number of days in the year (365). The average persons per night for those arriving by air for tourism/holiday was around 72, with 25 tourists and 47 visiting St Helenians. Like all averages, this does not measure the actual number of people on St Helena on every night of the year – on some nights, there would have been more, and some nights less.

    Characteristics of arrivals for tourism/holiday

    Charts 6a to 6c show various characteristics of tourism/holiday visitors that arrived by air in the last 12 months. There were slightly more men than women, and almost 70% were 40 or older. Apart from St Helenian, the most common nationalities were British, South African, and French (20%, 17% and 3% respectively).

    Births and deaths

    There were two births between July and September, the lowest quarterly number recorded since at least 2010. It brings the total number of births so far in 2018 to 15. There were seven deaths in the third quarter of 2018, which was also very low compared with recent trends. 33 deaths have been recorded to date in 2018 – more than double the number of births. Statistics on births and deaths are derived from records maintained by the Customer Service Centre, St Helena Post Office.

    Total population

    Estimates of the total population are calculated by combining the number of arrivals and departures and the number of births and deaths with the estimated population from the 2016 Census. At the end of September 2018 the number of St Helenians on St Helena was estimated to be 4,282, an increase of 47 compared to August 2018 and of 228 compared to September 2017. The estimated number of persons on St Helena, residents plus visitors, was 4,539, about the same as the previous month but an increase of 99 compared to the year before.

    Definitions and methodology

    The classification of arrivals and departures into purpose of visit or departure is based on the declarations made to Immigration Officers. Tourism/holiday includes short-term visitors or departures (i.e. less than six months) for tourism or holiday purposes, and it includes St Helenians visiting short-term to see family and friends, both those that live permanently abroad and those who are away for a period of overseas employment. Day visitors arriving on cruise ships are not included in either arrivals or departures. Business and employment includes short-term and long-term arrivals who arrive for work purposes, including those employed by the St Helena Government on contract (and their families). Returning residents are people who are returning to their normal place of residence (for arrivals, this excludes those returning for the purpose of business or employment). It also includes people returning permanently from periods of overseas employment. Transit includes those for whom St Helena is not their final destination; it includes most arrivals by yacht and any people transiting to or from a ship via air.

    Three categories of the total population are used. The on-island population is an estimate of the total number of people on St Helena at the end of the given period (this is sometimes also referred to as the ‘de facto’ population). The resident population is an estimate of the total number of people living on St Helena (i.e. excluding any short-term visitors), regardless of their nationality. The on-island St Helenian population is an estimate of the total number of St Helenians on the island, regardless of their residence status.

    Data improvements

    The Statistics Office aims to constantly improve the quality and usefulness of the statistics it produces. For this release, new series have been calculated for 2017 and earlier, to distinguish St Helenians visiting on holiday from other tourists.

    Two adjustments have also been to improve comparability between the statistics derived from the new data management system introduced by the Immigration Office in January 2018 and the previous system. The first adjustment is that St Helenians returning for a short term holiday visit from overseas employment have been categorised within the tourism/holiday grouping as St Helenians returning for a holiday (they had been previously categorised as returning residents). The second adjustment is that persons arriving on a yacht have been uniformly classified in the transit category, unless their destination was St Helena.

  • STATISTICS UPDATE: POPULATION, ARRIVALS AND DEPARTURES

    Data on Population, including total population and arrivals and departures up to September 2018 have been released on October 12, 2018: Population.

    Additional statistical series and indicators are available on the Statistics Data page, and published statistical reports, including Statistical Bulletins, can be found on the Statistics Reports and Publications page.

    We welcome comments and suggestions on any of the statistics published by the Statistics Office. Please email: statistics@sainthelena.gov.sh, call tel: 22138, or visit the office in person on the second floor of the Castle, Jamestown.

  • STATISTICAL BULLETIN NO. 9, 2018 – PRICES

    This bulletin includes estimates of the latest annual price inflation rates for the third quarter of 2018, calculated from the Retail Price Index (RPI). The data released in this Bulletin, including the RPI itself, can be downloaded from the St Helena Statistics website at: www.sainthelena.gov.sh/statistics-data. Detailed data can be accessed in Excel format here. The pdf version of the full Bulletin can be found here.

    Average inflation rate

    The latest rate of annual price inflation is estimated to be 4.1%, between the third quarter of 2018 and the third quarter of 2017. This is a 0.7 percentage point increase from the previous quarter, when the annual price inflation rate was measured at 3.4% (Chart 1).

    Contributing factors

    The two price changes with the most impact this quarter were the increases in the price of water from Connect, and the increase in the local telephone service provided by Sure. There were some other notable price increases, such as flour and soft drinks, but the price of some imported fruit, for example apples and oranges, fell – this is consistent with a reduction in the import duty from 20% to 5% for all fruit and vegetables without added salt or sugar.

    There are more than 200 items in the RPI ‘basket’, but some 70% were unchanged in price from the previous quarter. While increases in freight rates for the MV Helena will tend to increase the price of imported goods, the depreciation of the Rand compared to the St Helena Pound over the year (of just over 5%) has the opposite effect, by decreasing their price. The ability of the MV Helena to transport more weight per container may also have helped mitigate the price increases in freight. The prices of goods imported from South Africa and the United Kingdom are also affected by inflation in those economies; in August, annual inflation was 4.9% in South Africa and 2.7% in the UK.

    Inflation rates of RPI categories

    Average prices for all the categories of the RPI increased compared to the year before (Chart 2) – in other words, inflation rates were all positive. Categories with the highest rates were ‘Communications’, with an annual inflation rate of 10.8% compared to 0.9% last quarter, and ‘Housing’, with a rate of 6.9% compared to 4.5% last quarter. These rates reflect the impact of the increases to the telephone and water tariffs, introduced by Sure and Connect respectively.

    ‘Household energy’ remains the expenditure category with the lowest annual inflation rate, at 1.4%. This is mainly due to the price for domestic electricity, which accounts for over 85% of the category but whose price has not changed since 2016. The annual inflation rate of food was 2.8%, which means that the average price of food has increased compared to a year ago, but at a slightly lower annual rate than last quarter. This is the result of a combination of factors, including the reduction in import duty from 20% to 5% for all fruit and vegetables without added salt or sugar and the slight fall in the value of the Rand compared to a year ago (which makes imported goods cheaper), offsetting some of the increase in prices caused by changes to freight rates and price inflation in South Africa and the UK.

    What is price inflation?

    Price inflation is the change in the average prices of goods and services over time. The rate of price inflation is calculated from the change in the Retail Price Index (RPI), which is the official measure of the average change in the prices of goods and services paid by consumers. The RPI is estimated each quarter, or once every three months, and the rate of price inflation is usually quoted on an annual basis; that is, comparing price changes over a twelve month period. Prices and the RPI tend to go up, but they can occasionally go down – which is price deflation.

    Why do we measure inflation?

    An accurate measure of price inflation helps understand the extent and nature of the impact of price changes on the government, businesses, households and individuals.

    How is the RPI calculated?

    The basis for the RPI is the average weekly cost of goods and services purchased by households on St Helena, sometimes called the ‘shopping basket’. Items which households purchase more of, such as food, have the biggest share of the RPI basket. The current RPI uses a basket from the latest Household Expenditure Survey in 2017; prices of the items in the basket are collected every quarter, and the price of the total basket is compared to the price in the baseline period, the first quarter of 2018. By convention, the value of the basket in the baseline period is scaled to 100, and the RPI values are quoted in relation to that baseline. For example, an RPI value of 120 means that average prices have increased by 20 per cent compared to those recorded in the baseline period.

    What happens when items are not available?

    If an item of the ‘basket’ is not available then either the previous price will be carried forward from the previous quarter, or a suitable substitute item will be identified and an adjustment calculation made. Care is taken to ensure that this substitute item represents the item category and that it does not introduce error to the measurement of the RPI. An important principle is that price changes should reflect actual price increases, and not changes in the quality of items.

  • STATISTICS UPDATE: POPULATION

    Data on Population, including total population and arrivals and departures up to August 2018 have been released on September 25, 2018: Population.

    Additional statistical series and indicators are available on the Statistics Data page, and published statistical reports, including Statistical Bulletins, can be found on the Statistics Reports and Publications page.

    We welcome comments and suggestions on any of the statistics published by the Statistics Office. Please email: statistics@sainthelena.gov.sh, call tel: 22138, or visit the office in person on the second floor of the Castle, Jamestown.

  • STATISTICS UPDATE: DATA FILES

    As of 18 September 2018, the following files have been updated:

    Inflation, including average annual price inflation rates and the Retail Price Index – latest data are Quarter 2, 2018.

    Benefits, including total households claiming income related benefits and persons claiming the basic island pension and unemployment benefits  – latest data are August 2018

    Construction, including data on building permits and construction activity – latest data are Quarter 2 2018

    Population, including births, deaths, total population, and arrivals and departures – latest data are July 2018

    Ascension Population, including population figures from Ascension Island – Quarter 2 2018

    Exchange Rates, including the value St Helena pound compared to the US Dollar, South African Rand, and the Euro – latest data August 2018

    Additional statistical series and indicators are available on the Statistics Data page, and published statistical reports, including Statistical Bulletins, can be found on the Statistics Reports and Publications page.

    We welcome comments and suggestions on any of the statistics published by the Statistics Office. Please email: statistics@sainthelena.gov.sh, call tel: 22138, or visit the office in person on the second floor of the Castle, Jamestown.

  • STATISTICAL BULLETIN NO. 8, 2018 – POPULATION

    This Bulletin presents the latest estimates of the size of the population of St Helena, the number of arrivals and departures (including detailed statistics on arrivals by air), and the number of births and deaths.

    The data released in this Bulletin can be downloaded in Excel format from the ‘Population’ file on the St Helena Statistics website at: www.sainthelena.gov.sh/statistics-data.

    Population estimates

    At the end of June 2018 the number of St Helenians on St Helena was estimated to be 4,300, almost 7% higher than at the end of June 2017, and very close to the peak number of 4,334 recorded at the end of December 2017. The estimated number of persons on St Helena, residents plus visitors, was 4,663, is a slight decrease compared to the end of March 2018, but a 5.3% annual increase compared to the end of June 2017.

    Arrivals and departures

    The total number of arrivals for the second quarter of 2018 was estimated to be 1,093 (see Table 1). This is much lower than the 1,852 arrivals in the first quarter, when both the new scheduled air service and the RMS St Helena were operating. However compared to a year ago, when there were 770 arrivals in the second quarter, it is a significant increase of 323 people or more than 40%.

    Of the 1,093 arrivals in the second quarter, 77% (841) arrived by air, with the remainder arriving by yachts or ships, usually in transit to other destinations. As expected, as a result of moving into the off-peak season, the number of air arrivals in the second quarter was around 200 less than the first quarter, when 1,038 people arrived by air. The last and first quarters of each year usually see a larger number of visits, since these are the warmer months on St Helena, and St Helenians living overseas tend to visit during this period (see Chart 2).

    Since the scheduled air service began, 30% of all persons arriving by air have been tourists – excluding those St Helenians who live abroad returning for a short-term holiday, who were around 16% of all persons. People returning to their home on St Helena were a further 24%, and those arriving on St Helena for business, including persons and their families recruited overseas to work on St Helena, were 25% (Chart 3).

    Within the group of passengers who came to St Helena for a short-term holiday visit, 35% were St Helenian, 22% were British, and 21% were South African – comprising together just under 80% of all arrivals. Of the remainder, most were from countries in Europe (Chart 4).

    Further details of air arrivals are given in Table 1, and in the ‘Population’ data file at www.sainthelena.gov.sh/statistics-data.

    Even though the number of tourists arriving on St Helena was greater than the number of St Helenians arriving for a holiday to visit family and friends, the total number of nights they stayed on the island was less. This is because, on average, visiting St Helenians tend to stay longer than those visiting for tourism purposes (Chart 5).

    Table 2 has more details, including totals by quarter and the average length of stay for St Helenians on holiday visits (30 days per visitor) and for non-St Helenian tourists (10 days per tourist). More data, including figures by month from 2010 onwards, are given in the ‘Population’ data file at www.sainthelena.gov.sh/statistics-data.

    The total number of departures for the second quarter of 2018 was 1,139, substantially less than the first quarter (1,957) but about the same as the fourth quarter of 2017. This reflects the typical observed seasonal pattern, when St Helenians visiting for the Christmas period return in the first quarter of the year. Just over two–thirds of all departures were people returning to their usual place of residence. Some 14% were people who left to take up an overseas employment opportunity or to emigrate, and a further 10% were residents of St Helena departing for a holiday (see Table 3).

    Births and deaths

    In the second quarter of 2018, there were a total of seven births and 13 deaths registered on St Helena; this is almost the same as the previous quarter, when there were also 13 deaths, but six births.

    However the number of births almost halved compared to the same period of 2017, where 13 births were reported. In recent years, the number of deaths has exceeded births – during the last twelve months, there have been 27 births and 57 deaths.