hamzaupwork.com

Category: Statistics

  • Statistical Update: Price Inflation

    Latest index value and inflation rates for Q4 2024

    The Statistics Office has released new estimates of the Consumer Price Index (CPI) and the annual inflation rate. For the fourth quarter of 2024 the CPI has been measured at 103.1; in Q4 2023 the CPI was 95.3, which results in an annual inflation rate of 8.2%. This is much higher than the annual rate for Q3 2024 (which was 2.9%), and is the highest annual rate since 2009.

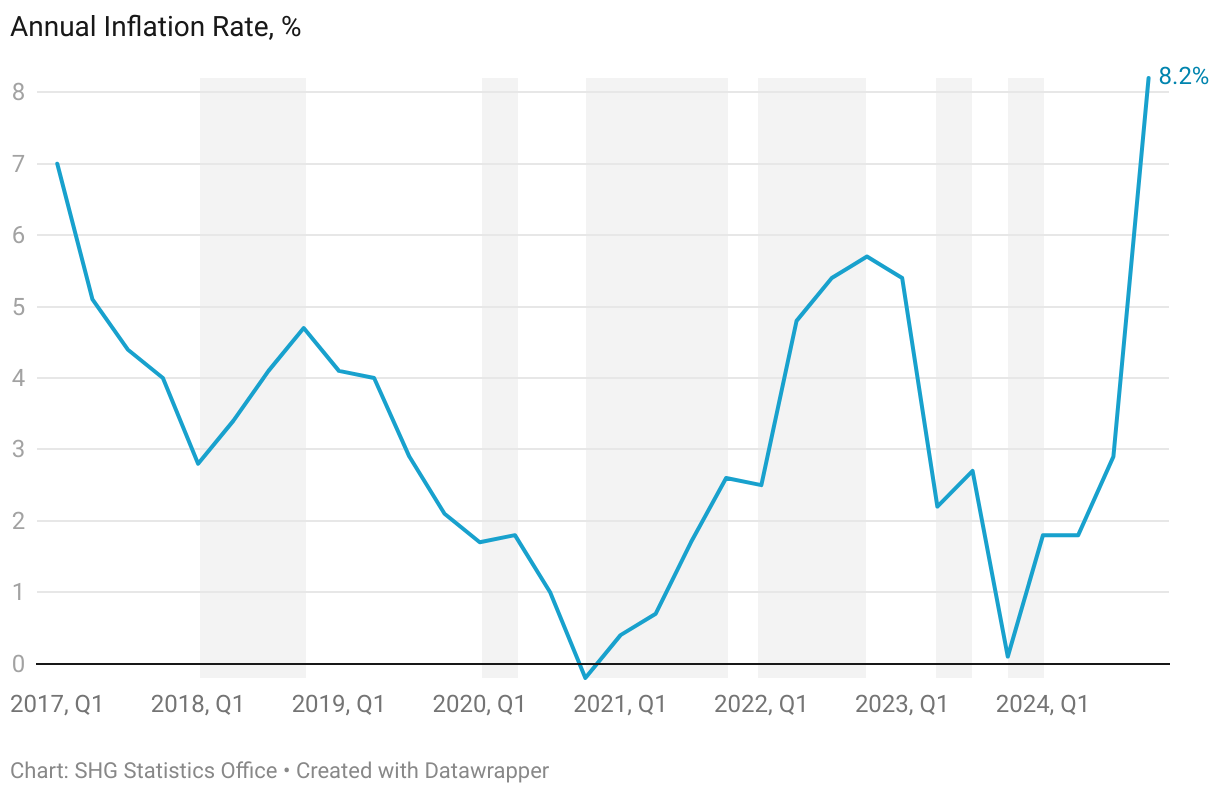
    Note that the index has been ‘rebased’ to 100 in Q3, 2024, and there has been a terminology change to Consumer Price Index (from the previous term Retail Price Index) as a result of a slight change in the index composition to make it more internationally consistent.

    Price changes over the last year

    On average, all broad groups of items saw their prices rise compared to a year ago. Some of the most significant changes were increases in electricity prices in January and July, increases in the price of telephone tariff and mobile data packages in July, and increases in the price of bread, local meat, and public transport in December. Additionally, the substantial drop in the price of broadband internet and mobile phone data packages in October 2023 is now no longer affecting the annual price inflation rate. This has resulted in an annual average price increases of 28.1% in Household Energy, 18.4% in Communications, and 9.7% in Food – the annual increase in average Food prices is the highest since Q2, 2017.

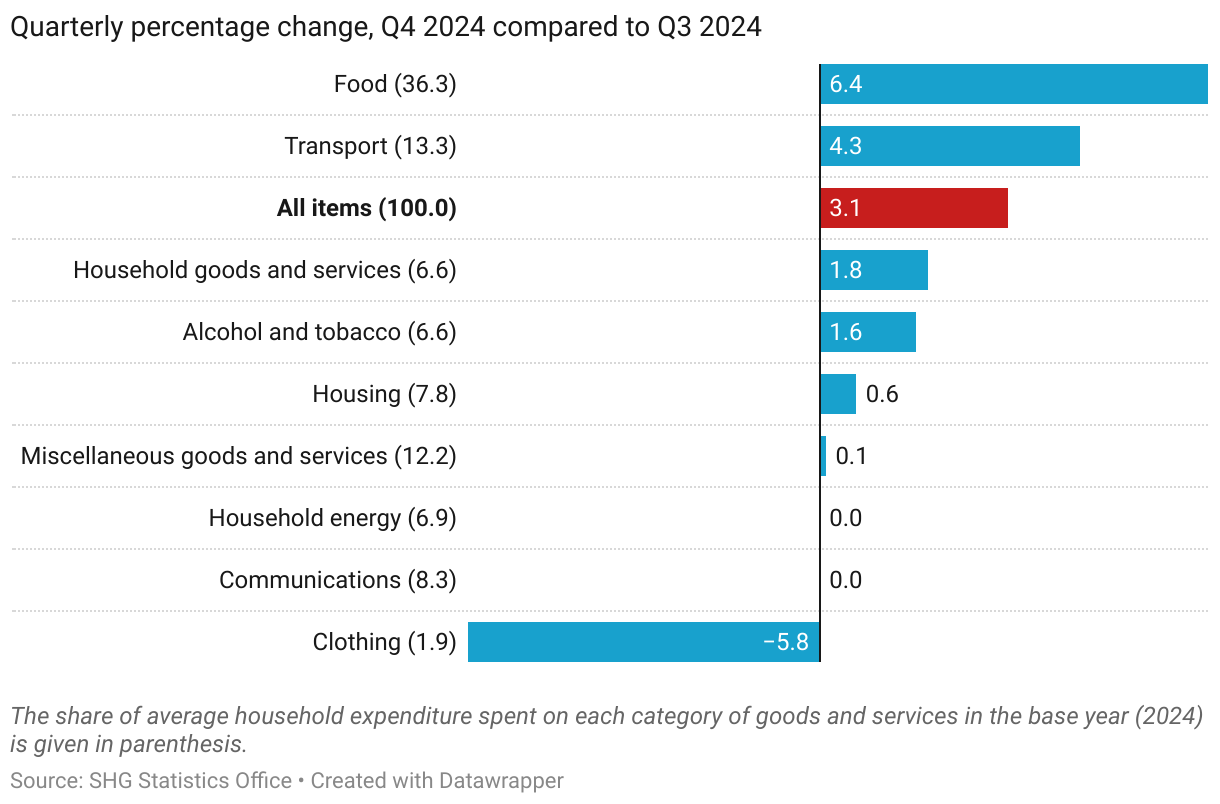
    Price changes over the last quarter

    The quarterly change in the CPI was 3.1%, comparing Q4 2024 to Q3 2024. All groups of categories experienced average increases since the last quarter, apart from the Clothing, Communications, and Household Energy groups (due to their nature, clothing items tend to change frequently, depending on stock and demand). The groups with the highest quarterly increases were Food (6.4%) and Transport (4.3%), the consequence of an increase in the prices of goods and services, especially bread, meat, and the public bus service.

    Note that normally price changes in both the UK and South Africa have a strong impact on prices on St Helena, since the majority of goods imported are purchased in those two countries, although for the Q4 2024 Index, price increases in local goods and services have had a major effect. In December 2024, annual consumer price inflation in the UK was measured at 2.5% (UK Office for National Statistics), down from 2.6% in November. In South Africa, annual consumer price inflation was measured at 3.0% in December 2024 (Statistics South Africa), up from 2.9% in November 2024. Changes in the value of the Rand compared to the Pound can have a large effect on the price of goods purchased in South Africa. For example, for the period January to December 2024, the Pound averaged 23.4 Rand, which is a 2.1% increase compared to the same period in 2023, when it was 23.0. This change tends to counteract the effect of price inflation in South Africa on final shop-floor prices on St Helena.

    Methodology

    Rebasing the Index

    The Index was rebased in the third quarter of 2024, following the 2023 Household Expenditure Survey (HES) and subsequent analysis by the Statistics Office. The HES reviewed the composition of the average ‘shopping basket’ of goods and services purchased by households on St Helena, to make sure it reflects current spending habits. The Statistics Office has also reviewed the items that are used to represent each category of spending in the basket, to make sure they are also up to date and relevant. The rebased Index includes 205 categories of expenditure, within nine broader groupings; these broader groupings are unchanged from the previous Index. Within the broad groupings, the detailed categories of expenditure have been adjusted slightly to better align with international guidelines, and in particular they now only include expenditure related to household consumption, and not all expenditures. This has also made a change to the terminology necessary: the Index has been renamed the Consumer Price Index (CPI), rather than the Retail Price Index (RPI).

    What is price inflation and how is it measured?

    Price inflation is the change in the average prices of goods and services over time. The rate of price inflation is calculated from the change in the CPI, which is the official measure of the average change in the prices of goods and services paid by consumers. The CPI is estimated each quarter, i.e. once every three months, and the rate of price inflation is usually quoted on an annual basis; that is, comparing price changes over a 12-month period. Prices and the CPI tend to go up, but they can occasionally go down – which is known as price deflation.

    The CPI is a statistical measure of the change in consumer prices on St Helena; an increase in the CPI means that, on average, prices have gone up since the last time they were measured, and a decrease in the CPI means that, on average, prices have fallen. The annual change in the CPI is called the annual inflation rate, and is the usual measure of the change in prices in an economy. The CPI is an average measure: if it goes up, it does not mean that all prices have gone up, and similarly, if it goes down, it does not mean that all prices have fallen.

    Why do we measure inflation?

    An accurate measure of price inflation helps understand the extent and nature of the impact of price changes on the government, businesses, households and individuals. Inflation rates are often used in budgeting and accounting processes so that costs can be adjusted for the effect of price changes.

    How is the CPI calculated?

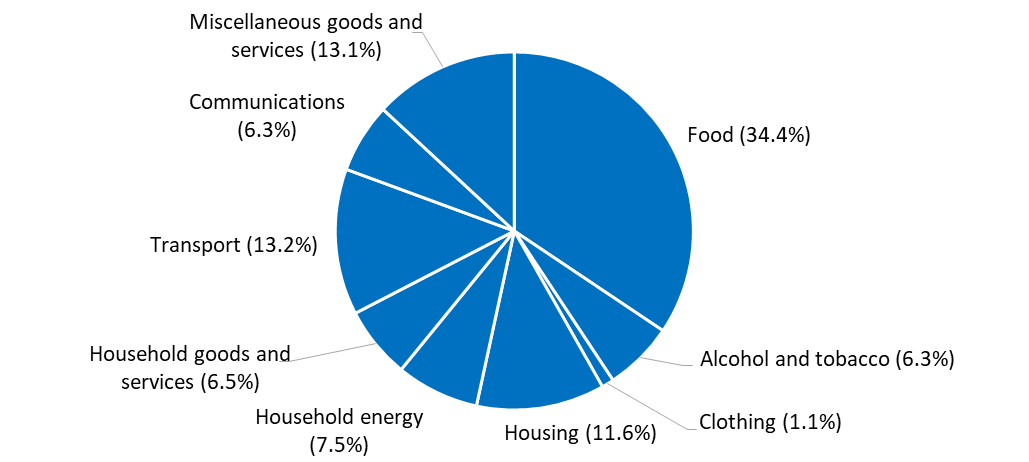
    The basis for the CPI is the average weekly cost of goods and services purchased by households on St Helena for consumption, sometimes called the CPI ‘shopping basket’. Items which households purchase more of, such as food, have the biggest share of the CPI basket. The current CPI uses a basket from the latest Household Expenditure Survey in 2023; prices representing the groups of items in the basket are collected every quarter, and the price of the total basket is compared to the price in the baseline period, the third quarter of 2024. By convention, the value of the basket in the baseline period is scaled to 100, and the CPI values are quoted in relation to that baseline. For example, a CPI value of 120 means that average prices have increased by 20 per cent compared to those recorded in the baseline period.

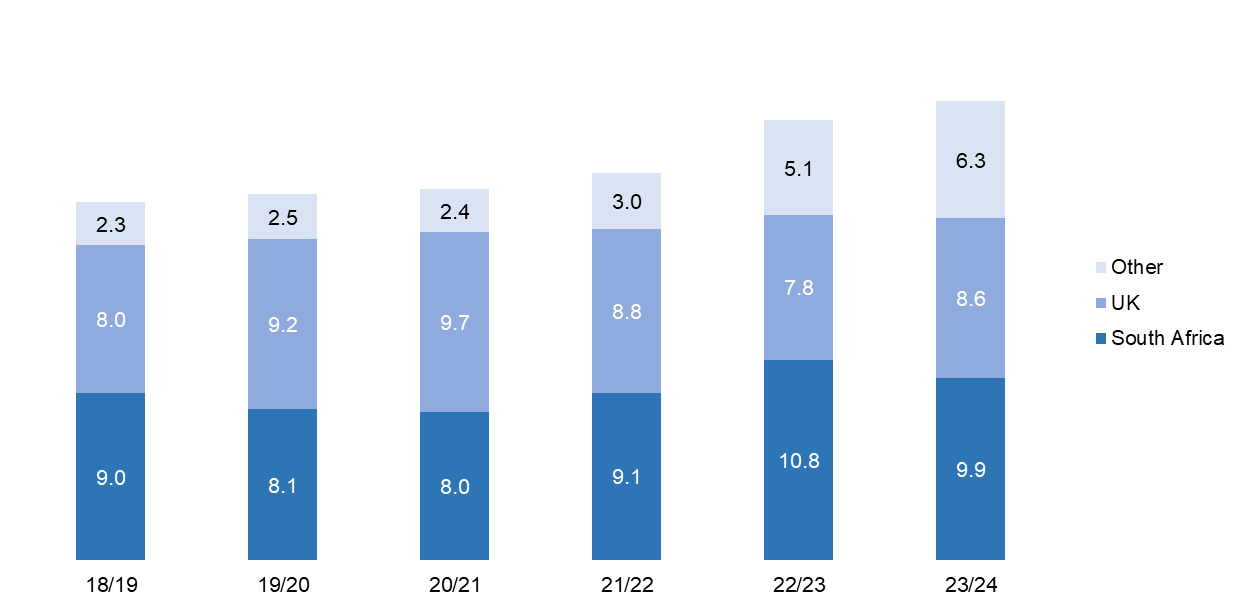
    Composition of average household weekly expenditure (Q3 2024 CPI ‘Shopping Basket’)

    What happens when items are not available?

    If an item of the ‘basket’ is not available then either the previous price will be carried forward from the previous quarter, or a suitable substitute item will be identified and an adjustment calculation made. Care is taken to ensure that this substitute item represents the item category and that it does not introduce error to the measurement of the CPI. An important principle is that price changes should reflect actual price increases and decreases, and not changes in the quality of items.

    Where can I get the data?

    For detailed tables of the CPI and annual inflation rates from 1994 onwards, please visit: https://www.sainthelena.gov.sh/st-helena/statistics/the-economy and download the ‘inflation’ data file. Other datasets, bulletins and reports are also available on our website:  www.sainthelena.gov.sh/statistics.

    Have more questions or comments?

    Please get in touch. We are Neil Fantom, Statistical Commissioner, Kelly Clingham and Justine Joshua, Senior Statistical Assistants and Courtney O’Dean, Statistics Assistant. You can find us in person at the Statistics Office on the top floor of the Post Office, Jamestown. You can also contact us by telephone on our direct line through 22138. If calling from overseas, the international dialling code for St Helena is +290. Our general office e-mail address is statistics@sainthelena.gov.sh, or you can email team members directly (the format is firstname.lastname@sainthelena.gov.sh).

  • Statistical Update: Arrivals and Departures

    The latest provisional estimates have been released for the numbers of passenger arrivals and departures to and from St Helena, up to the end of November, 2024.

    Note: this release was updated on April 15 2025; estimates of the arrivals of St Helenians and those arriving for leisure are not yet available for November 2024 onwards, due to a change in immigration arrival procedures.

    Arrivals

    In November 2024, there were an estimated 421 arrivals, with 373 arriving by air; this compares with 332 arrivals in November 2023, with 315 arriving by air.

    https://datawrapper.dwcdn.net/EA4bJ/27/

    During the last 12 months (December 2023 to November 2024) there have been 4,365 arrivals, compared to 4,196 in the same period a year ago – a 4.0% increase.

    Departures

    In November 2024 there were an estimated 319 departures from the island, 102 less than the number of arrivals. During the last 12 months (December 2023 to November 2024), there were a total of 4,328 departures, compared to 4,195 in the same period a year ago – a increase of 3.2%.

    https://datawrapper.dwcdn.net/KlqTH/21/

  • Statistical Update: Arrivals and Departures

    The latest provisional estimates have been released for the numbers of passenger arrivals and departures to and from St Helena, up to the end of October, 2024.

    Arrivals

    In October 2024, there were an estimated 330 arrivals, with 300 arriving by air; this compares with 289 arrivals in October 2023, with 220 arriving by air. 149 people arrived for leisure, including 91 non-St Helenians and 58 St Helenians visiting family and friends on the island.

    https://datawrapper.dwcdn.net/EA4bJ/27/

    During the last 12 months (November 2023 to October 2024) there have been 4,279 arrivals, compared to 4,224 in the same period a year ago – a 1.3% increase. Of those arrivals, 1,983 were for a leisure purpose, this is 4.8% more than the same period in the previous year, when arrivals for leisure purposes totalled 1,893. There were 889 tourists (i.e. non-St Helenian leisure visitors), a 3.7% increase compared the previous twelve month period, when there were 857.

    Departures

    In October 2024 there were an estimated 252 departures from the island, 78 less than the number of arrivals. During the last 12 months (November 2023 to October 2024), there were a total of 4,230 departures, compared to 4,298 in the same period a year ago – a decrease of 1.6%.

    https://datawrapper.dwcdn.net/KlqTH/21/

    Get the data

    A file in Excel format with detailed monthly statistics on arrivals and departures to October 2024 can be downloaded here.

  • Statistical Update: Population

    The St Helena Statistics Office has released new provisional estimates of the number of people on St Helena by age, sex, residency and nationality, and the number of births and deaths, up to the end of October 2024.

    At the end of October 2024 there were an estimated 4,200 people on the island, an increase of 72 from the end of September, when there were an estimated 4,128. Of the people on the island, an estimated 4,058 people were residents, and 142 were visitors. This compares to an estimated 4,017 residents on the island at the end of September, and 4,078 residents on the island a year ago, at the end of October 2023.

    https://datawrapper.dwcdn.net/BKVr4/34/

    Compared to a year ago, at the end of October 2023, there has been a decrease in the number of resident children on-island (0-14 years) from 534 to 518, and a decrease in those of roughly working age (15-64 years) from 2,415 to 2,373. But the number of people aged 65 and over increased, from 1,129 to 1,167. The Old Aged Dependency Ratio of the resident on-island population (the number of those 65 and over compared to those of roughly working age) was 49.2 at the end of October 2024.

    The chart illustrates the estimated St Helenian resident population at the end of October 2024 by five-year age groups and sex. The age group with the smallest number of St Helenians is 0-4 (120), followed closely by 20-24 (128); the age groups with the most is 55-59 and 60-64, both with 340 people.

    https://datawrapper.dwcdn.net/1Wutc/16/

    A data file with monthly population estimates to the end of October 2024 can be downloaded here. The file includes population totals by age, sex, residency and nationality, and the number of arrivals, departures, births, and deaths.

  • Statistical Update: Population

    The St Helena Statistics Office has released new provisional estimates of the number of people on St Helena by age, sex, residency and nationality, and the number of births and deaths.

    At the end of September 2024 there were an estimated 4,128 people on the island, an increase of 82 from the end of August, when there were an estimated 4,046. Of the people on the island, an estimated 4,023 people were residents, and 105 were visitors. This compares to an estimated 3,935 residents on the island at the end of August, and 4,077 residents on the island a year ago, at the end of September 2023.

    https://datawrapper.dwcdn.net/BKVr4/31/

    Compared to a year ago at the end of September 2023 there has been a decrease in the number of resident children on-island (0-14 years) and those of roughly working age (15-64 years), by 18 and 57 respectively, but an increase of the number of those 65 and over, by 21. As a result the Old Aged Dependency Ratio of the resident on-island population (the number of those 65 and over compared to those of roughly working age) has increased to 48.6 at the end of September 2024, compared to September 2023 when it was estimated to be 46.5.

    The chart illustrates the estimated St Helenian resident population at the end of September 2024 by five-year age groups and sex. The age group with the smallest number of St Helenians is 20-24 (117), followed closely by 0-4 (118); the age group with the most is 60-64, with 339 people.

    https://datawrapper.dwcdn.net/1Wutc/7/

    A data file with monthly population estimates to the end of September 2024 can be downloaded here. The file includes population totals by age, sex, residency and nationality, and the number of arrivals, departures, births, and deaths.

  • Statistical Update: Arrivals and Departures

    The latest provisional estimates have been released for the numbers of passenger arrivals and departures to and from St Helena.

    Arrivals

    In September 2024, there were an estimated 315 arrivals, with 310 arriving by air. 73 people arrived for leisure, including 27 non-St Helenians and 46 St Helenians visiting family and friends on the island. 5 people arrived by yacht or ship. During the last 12 months (October 2023 to September 2024) there have been 4,238 arrivals, compared to 4,170 in the same period a year ago – a 1.6% increase. Of those arrivals, 1,911 were for a leisure purpose, this is 0.7% more than the same period in the previous year when arrivals for leisure purposes totalled 1,898.

    https://datawrapper.dwcdn.net/EA4bJ/25

    Departures

    In September 2024 there were an estimated 231 departures from the island, 84 less than the number of arrivals. 223 left by air with the remaining 8 leaving by sea. During the last 12 months (October 2023 to September 2024), there were a total of 4,280 departures, compared to 4,225 in the same period a year ago – an increase of 1.3%, and 42 more than the number of arrivals.

    https://datawrapper.dwcdn.net/KlqTH/19

    Get the data

    A file in Excel format with detailed monthly statistics on arrivals and departures to September 2024 can be downloaded here.

  • Statistical Update: Population

    The St Helena Statistics Office has released new provisional estimates of the number of people on St Helena by age, sex, residency and nationality, and the number of births and deaths.

    At the end of August 2024 there were an estimated 4,046 people on the island, a decrease of 57 from the end of July, when there were an estimated 4,103. Of the people on the island, an estimated 3,939 people were residents, and 107 were visitors. This compares to an estimated 3,974 residents on the island at the end of July, and 3,986 residents on the island a year ago, at the end of August 2023.

    https://datawrapper.dwcdn.net/BKVr4/31/

    Compared to a year ago at the end of August 2023 there has been a decrease in the number of resident children on-island (0-14 years) and those of roughly working age (15-64 years), by 29 and 48 respectively, but an increase of the number of those 65 and over, by 30. As a result the Old Aged Dependency Ratio of the resident on-island population (the number of those 65 and over compared to those of roughly working age) has increased to 49.5 at the end of August 2024, compared to August 2023 when it was estimated to be 47.2.

    The chart illustrates the estimated St Helenian resident population at the end of August 2024 by five-year age groups and sex. The age group with the smallest number of St Helenians is 20-24 (117), followed closely by 0-4 (119); the age group with the most is 60-64, with 333 people.

    https://datawrapper.dwcdn.net/1Wutc/7/

    A data file with monthly population estimates to the end of August 2024 can be downloaded here. The file includes population totals by age, sex, residency and nationality, and the number of arrivals, departures, births, and deaths.

  • Statistical Update: Price Inflation

    Latest index value and inflation rates for Q3 2024

    The Statistics Office has released new estimates of the Retail Price Index (RPI) and the annual inflation rate. For the third quarter of 2024 the RPI has been measured at 120.4. In Q3 2023 the RPI was 117.0, resulting in an annual inflation rate of 2.9%.

    https://datawrapper.dwcdn.net/qu053/5/

    The index uses 203 representative items to measure price changes in nine different major categories of household spending. Since a year ago, 82 items increased in price, 31 items decreased in price, and the price of 90 items remained unchanged.

    Price changes in both the UK and South Africa have a strong impact on prices on St Helena, since the majority of goods imported are purchased in those two countries. In September 2024, annual consumer price inflation in the UK was measured at 1.7% (UK Office for National Statistics), down from 2.2% in August. In South Africa, annual consumer price inflation was measured at 4.4% in August 2024 (Statistics South Africa), down from 4.6% in July 2024. Changes in the value of the Rand compared to the Pound can have a large effect on the price of goods purchased in South Africa. For example, for the period January to September 2024, the Pound averaged 23.6 Rand, which is a 3.5% increase compared to the same period in 2023, when it was 22.8. This change tends to counteract the effect of price inflation in South Africa on the final shop-floor prices on St Helena.

    Price changes by category

    All categories saw an increase in price since a year ago (Q3 2023), apart from the Communications category, which saw a significant drop in price due to changes in the tariffs introduced by the telecommunications provider (Sure) in October last year. This price drop continues to partly offset price increases in other categories, when measured over a one year period.

    https://datawrapper.dwcdn.net/iyYbU/25/

    The categories which contributed the most to the upward pressure in the annual inflation rate were Household Energy, Housing and Clothing. Prices for both water and electricity increased in January and July, and these items have a significant weight in the average shopping basket: 6.41% for electricity, and 1.25% for water. Apart from water, Housing was also affected by increases in the the price of building materials, maintenance services, and materials.

    https://datawrapper.dwcdn.net/HCa38/25/

    The quarterly change in the RPI was 2.6% (i.e. Q3 2024 compared to Q2 2024). All categories experienced average increases since last quarter, but categories with the highest quarterly increases were Communication (18.4%), Household Energy (12.5%), and Clothing (11.2%); those with the lowest were Transport, Food, and Miscellaneous Goods and Services.

    https://datawrapper.dwcdn.net/mDrpa/5/

    Frequently Asked Questions

    What is price inflation and how is it measured?

    Price inflation is the change in the average prices of goods and services over time. The rate of price inflation is calculated from the change in the RPI, which is the official measure of the average change in the prices of goods and services paid by consumers. The RPI is estimated each quarter, i.e. once every three months, and the rate of price inflation is usually quoted on an annual basis; that is, comparing price changes over a 12-month period. Prices and the RPI tend to go up, but they can occasionally go down – which is known as price deflation.

    The RPI is a statistical measure of the change in retail prices on St Helena; an increase in the RPI means that, on average, prices have gone up since the last time they were measured, and a decrease in the RPI means that, on average, prices have fallen. The annual change in the RPI is called the annual inflation rate, and is the usual measure of the change in prices in an economy. The RPI is an average measure: if it goes up, it does not mean that all prices have gone up, and similarly, if it goes down, it does not mean that all prices have fallen.

    Why do we measure inflation?

    An accurate measure of price inflation helps understand the extent and nature of the impact of price changes on the government, businesses, households and individuals. Inflation rates are often used in budgeting and accounting processes so that costs can be adjusted for the effect of price changes.

    How is the RPI calculated?

    The basis for the RPI is the average weekly cost of goods and services purchased by households on St Helena, sometimes called the RPI ‘shopping basket’. Items which households purchase more of, such as food, have the biggest share of the RPI basket. The current RPI uses a basket from the latest Household Expenditure Survey in 2017; prices representing the groups of items in the basket are collected every quarter, and the price of the total basket is compared to the price in the baseline period, the first quarter of 2018. By convention, the value of the basket in the baseline period is scaled to 100, and the RPI values are quoted in relation to that baseline. For example, an RPI value of 120 means that average prices have increased by 20 per cent compared to those recorded in the baseline period.

    Composition of average household weekly expenditure (Q1 2018 RPI ‘Shopping Basket’)

    What happens when items are not available?

    If an item of the ‘basket’ is not available then either the previous price will be carried forward from the previous quarter, or a suitable substitute item will be identified and an adjustment calculation made. Care is taken to ensure that this substitute item represents the item category and that it does not introduce error to the measurement of the RPI. An important principle is that price changes should reflect actual price increases and decreases, and not changes in the quality of items.

    Where can I get the data?

    For detailed tables of the RPI and annual inflation rates from 1994 onwards, please visit: https://www.sainthelena.gov.sh/st-helena/statistics/the-economy and download the ‘inflation’ data file. Other datasets, bulletins and reports are also available on our website:  www.sainthelena.gov.sh/statistics.

    Have more questions or comments?

    Please get in touch. We are Neil Fantom, Statistical Commissioner, Kelly Clingham and Justine Joshua, Senior Statistical Assistants and Courtney O’Dean, Statistics Assistant. You can find us in person at the Statistics Office on the top floor of the Post Office, Jamestown. You can also contact us by telephone on our direct line through 22138. If calling from overseas, the international dialling code for St Helena is +290. Our general office e-mail address is statistics@sainthelena.gov.sh, or you can email team members directly (the format is firstname.lastname@sainthelena.gov.sh).

  • Statistical Update: Imports of Goods

    This update releases new estimates of the purchase value of goods imported to St Helena during the 2023/24 financial year. The detailed data tables used to prepare this release can be downloaded here.

    Total value of goods imported

    The total value of goods imported to St Helena during the 2023/24 financial year is estimated to be £24.8 million, an increase of £1.0 million compared to the previous year, or 4.3%.

    Chart 1. Total value of goods imported to St Helena, 2018/19 to 2023/24, £ millions, current prices (i.e. unadjusted for inflation)

    Note that the value of goods is ‘free on board’, which means that it excludes freight and insurance charges. Value-added taxes, sales taxes and other fees paid by importers are also excluded, since these statistics are compiled from declarations made by importers to the St Helena Customs authorities, which do not require these additional fees to be included. It is also not adjusted for inflation; a common term for this is that the valuation is in ‘current prices’.

    Type of goods imported

    Goods imported to St Helena predominantly fall into one of four major groups: machinery and transport equipment, manufactured goods and articles, food, and mineral fuel and lubricants. Diesel fuel, which is used in St Helena’s electricity power station, is the largest single item each year, typically arriving by fuel tanker in consignments every quarter. In 2023/24 the value of imported fuel continues to be higher than in previous years, following the global increase in price resulting from the invasion of Ukraine by Russia in 2022.

    Chart 2. Imports of goods by commodity group, 2018/19 to 2023/24, £ millions, current prices (i.e. unadjusted for inflation)

    Imports of food, beverages and tobacco

    Food was the third largest group of commodity imports in 2023/24, with a purchase value of £4.8 million. Within the food grouping, cereals and cereal preparations was the largest sub-group (including items such as flour and rice), vegetables and fruit the second largest, and meat and meat preparations the third largest. The purchase value of beverages and tobacco imported was around a quarter of the value of food (£1.3 million); within that group alcoholic beverages made up around half of all imports.

    Chart 3. Imports of food, 2023/24, £ thousands
    Chart 4. Imports of beverages and tobacco, 2023/24, £ thousands

    Country of purchase of imported goods

    Most goods imported to St Helena are purchased in the United Kingdom or South Africa, reflecting the close ties between St Helena and the UK, and the historical cargo shipping routes between Cape Town in South Africa and Jamestown in St Helena. Historically, St Helenians tend to spend roughly the same in the UK and South Africa on imported goods, although slightly more has been spent in South Africa in the last three years than in the UK; this may reflect the relative weakness of the Rand compared to the Pound, making South African goods cheaper to purchase. Imports from other countries were mostly mineral fuel (diesel and petrol).

    Chart 5. Imports of goods by recorded country of purchase, 2018/19 to 2023/24, £ millions, current prices (i.e. unadjusted for inflation)

    Methodology

    Concepts and definitions: The compilation methodology for international trade statistics on St Helena uses the guidelines published by the United Nations Statistics Division. Generally, imports and exports are transactions involving the exchange of goods or services between residents and non-residents of St Helena. For goods, imports and exports are usually recorded whenever a commodity crosses St Helena’s boundaries, typically a border entry point, or a ‘bonded’ warehouse (a place where goods liable to import taxes are stored until those taxes are paid). For the purpose of St Helena’s import statistics, the date of customs duty assessment is usually taken to be a reasonable estimate of the date at which the commodity has effectively crossed the border. Since goods are counted as imported when they enter the domestic economy, goods imported into bonded warehouses are only counted when they are released from bond. Goods imported after being temporarily exported for repair are also not included. Similarly, machinery imported on a temporary basis, for example to support construction products, is not included, if it can be identified. This update focuses on the imports of goods but it should be noted that St Helena’s trade with other countries also includes imports and exports of services. Imports of services include medical treatment and training programmes abroad, communications services, and services delivered by persons visiting the Island but who do not live on St Helena. St Helena’s service exports include spending on St Helena by tourists and short-term visitors; estimates of this non-resident spending on St Helena are available in the detailed data file, here.

    Data source: Statistics on the imports of goods are derived primarily from the administrative records resulting from the Customs process, particularly the legal requirement for a declaration to be made to the Customs authorities whenever goods are imported or exported. These declarations are stored in a computer system called ASYCUDA, managed by the Customs Office. Although the Statistics Office conducts a number of consistency checks to identify and correct valuation and classification errors, the data quality of statistics on international trade depends on the quality of information entered into the ASYCUDA system by importers and by Customs officials. The quality of the information collected by the Customs Office on the quantities of commodities imported does not currently permit the calculation of trade statistics on volumes or quantities.

    Valuation method: Values are reported in ‘current’ prices, that is, the value recorded at the time of the customs transaction, without any adjustment for price inflation (i.e. the changes in prices of commodities over time). On St Helena, the value recorded by importers for the assessment of import taxes and duties is ‘free-on-board’ (or FOB), rather than inclusive of ‘cost, insurance and freight’ (or CIF); import statistics are therefore also based on the FOB valuation of goods. This means that St Helena’s import statistics are based on the invoice value paid by the importer in the country of purchase, and they do not include the costs of shipment, or any duties or taxes paid in that country. Goods purchased in foreign currencies are valued in Pounds based on the exchange rate used for the Customs transaction, rather than the exchange rate used by the importer when they purchased the goods. If the rate used for the Customs transaction is not known, the average monthy ‘spot’ rate published by the Bank of England is used.

    Classification of commodities: Commodities are classified by importers on their customs declarations using an eight digit tariff code, which is based on the international six digit ‘Harmonised System’ classification maintained by the World Customs Organisation. In this report, and for the presentation of St Helena’s trade statistics generally, the Standard International Trade Classification is also used; this was developed for analytical purposes by the United Nations Statistics Division, while the Harmonised System is primarily designed for the administration of Customs systems. There are ‘correspondence tables’ between these two classification systems maintained by the United Nations, which enables St Helena’s trade statistics to be analysed and presented using either classification.

    Frequency: The trade statistics in this update are presented by financial year, and the Statistics Office currently analyses the ASYCUDA database every year. However, data are computed by quarter, which can allow calculation of trade statistics by calendar year, or by quarter if required. Any analysis of quarterly import statistics should be made with care, however, since they can be affected by the timing of cargo shipments and other issues.

  • Statistical Update: Arrivals and Departures

    The latest provisional estimates have been released for the numbers of passenger arrivals and departures to and from St Helena.

    Arrivals

    In August 2024, there were an estimated 203 arrivals, with 178 arriving by air. 53 people arrived for leisure, including 24 non-St Helenians and 29 St Helenians visiting family and friends on the island. 25 people arrived by yacht or ship. During the last 12 months (September 2023 to August 2024) there have been 4,334 arrivals, compared to 3,967 in the same period a year ago – a 9.3% increase. Of those arrivals, 1,981 were for a leisure purpose, this is 10.1% more than the same period in the previous year when arrivals for leisure purposes totalled 1,800.

    https://datawrapper.dwcdn.net/EA4bJ/25

    Departures

    In August 2024 there were an estimated 258 departures from the island, 55 more than the number of arrivals. 232 left by air with the remaining 26 leaving by sea. During the last 12 months (September 2023 to August 2024), there were a total of 4,338 departures, compared to 4,098 in the same period a year ago – an increase of 5.9%, and 4 more than the number of arrivals.

    https://datawrapper.dwcdn.net/KlqTH/19

    Get the data

    A file in Excel format with detailed monthly statistics on arrivals and departures to August 2024 can be downloaded here.