The St Helena Statistics Office has released new provisional estimates of the number of people on St Helena by age, sex, residency and nationality, and the number of births and deaths.
At the end of July 2024 there were an estimated 4,103 people on the island, a decrease of 36 from the end of June, when there were an estimated 4,139. Of the people on the island, an estimated 3,979 people were residents, and 124 were visitors. This compares to an estimated 4,028 residents on the island at the end of June, and 4,045 residents on the island a year ago, at the end of July 2023.
https://datawrapper.dwcdn.net/BKVr4/31/
Compared to a year ago at the end of July 2023 there has been a decrease in the number of resident children on-island (0-14 years) and those of roughly working age (15-64 years), by 38 and 54 respectively, but an increase of the number of those 65 and over, by 26. As a result the Old Aged Dependency Ratio of the resident on-island population (the number of those 65 and over compared to those of roughly working age) has increased to 48.8 at the end of July 2024, compared to July 2023 when it was estimated to be 46.6.
The chart illustrates the estimated St Helenian resident population at the end of July 2024 by five-year age groups and sex. The age group with the smallest number of St Helenians is 20-24 (122), followed closely by 0-4 (123); the age group with the most is 60-64, with 337 people.
https://datawrapper.dwcdn.net/1Wutc/7/
A data file with monthly population estimates to the end of July 2024 can be downloaded here. The file includes population totals by age, sex, residency and nationality, and the number of arrivals, departures, births, and deaths.
New estimates of economic activity on St Helena for 2022/23
This release presents new estimates of Gross Domestic Product (GDP) and Gross National Income (GNI) for 2022/23; some small revisions to previous published estimates have also been made. Note that per capita estimates for 2022/23 were also revised slightly (downward) on 4 December, 2023.
All estimates presented in this release should be considered provisional: GDP estimation is a complex task, and developing appropriate methods and data sources is an ongoing program of work. The statistics and indicators presented in this Bulletin can be downloaded in Excel format here.
Gross Domestic Product
GDP is a key indicator of economic activity used around the world: on St Helena it measures the total value of all the goods and services produced on the island during a year. For 2022/23, GDP at market prices is estimated to be £39.3 million and the annual change in the volume of goods and services produced by the economy compared to 2021/22 is estimated to be -2.1%, a decrease in GDP in real terms (Table 1).
Table 1. Estimates of Gross Domestic Product, 2018/19 to 2022/23, £ million
18/19
19/20
20/21
21/22
22/23
Current basic prices
37.4
36.4
37.6
37.2
38.8
Current market prices
39.2
38.0
39.4
39.0
39.3
Constant 22/23 market prices
42.0
40.0
40.9
40.1
39.3
Annual GDP growth rate
5.9%
-4.6%
2.1%
-1.8%
-2.1%
St Helena’s population size has fallen slightly in the last few years. Adjusted for the size of the population, GDP was estimated to be £9,090 per person in 2022/23, or $10,960 (Table 2). When inflation is taken into account GDP per capita decreased slightly, by -0.5%, compared to 2021/22.
Table 2. Estimates of Gross Domestic Product per capita, 2018/19 to 2022/23
18/19
19/20
20/21
21/22
22/23
GDP per capita (£, current)
8,390
8,370
8,730
8,880
9,090
GDP per capita (£, constant 22/23 prices)
8,990
8,820
9,080
9,140
9,090
Annual GDP per capita growth rate
3.9%
-1.9%
2.9%
0.7%
-0.5%
Estimate of average on-island population
4,693
4,563
4,527
4,422
4,339
GDP per capita ($, current)
11,020
10,670
11,430
12,140
10,960
Breakdown of value added by industrial activity
Table 3 shows the share of total value added by each major activity grouping (industrial activities are classified according to Revision 4 of the UN International Standard Industrial Classification, grouped to avoid disclosure of information about individual companies). Value added is the key component of GDP, and represents the total output of sole traders, businesses, government, and non-profit organisations, less the value of intermediate consumption (i.e. the value of goods and services used in the process of producing final goods or services.)
Table 3. Value Added by industrial activity, 2022/23
Value added (£m)
Share (%)
A: Agriculture, Forestry and Fishing
0.34
0.9
B-E: Quarrying, Manufacturing, Electricity, Water, and Sanitation
2.81
7.2
F: Construction
1.37
3.5
G: Wholesale and Retail Trade; Repair of Motor Vehicles
4.72
12.2
H: Transportation and Storage
1.68
4.3
I: Accommodation and Food Service Activities
0.62
1.6
J-K: Finance, Insurance, Information, Communication
6.09
15.7
L: Real Estate Activities
2.07
5.3
M, N, R, S: Other Activities and Services
1.49
3.8
O-Q: Government, Public Administration, Health and Education
17.60
45.4
Total
38.78
100.0
Note: Government and Public Administration (including Health and Education services) is valued net of depreciation, all other sectors are valued gross (i.e. including depreciation).
Apart from Government, Public Administration, Health and Education (which accounted for 45.4% of total value added in 2022/23), the largest groups were Finance, Insurance, Information and Communication (15.7%) and Wholesale and Retail Trade, including Repair of Motor Vehicles (12.2%). Production activities, including Quarrying, Manufacturing, Electricity, Water, and Sanitation, contributed around 7.2% of total value added in 2022/23, with Real Estate Activities (including rental properties and the value of owner-occupied housing) at 5.3% and Transportation and Storage (which includes the Airport) around 4.3%.
Gross National Income
A useful alternative measure to GDP is called Gross National Income (GNI), which values the economic activity of the Island’s residents, regardless of where that activity takes place. This is different to GDP, which is a measure of the total value of goods and services produced within the territorial boundaries of St Helena, regardless of whether that value is produced by its residents. GNI is derived from GDP by adding an estimate of the income earned abroad by residents and deducting an estimate of the income earned on St Helena by non-residents.
Table 4 shows the nominal levels of GNI and GNI per capita since 2018/19. St Helena’s estimated GNI per capita level is not yet high enough to have crossed the World Bank threshold that defines a ‘high income’ country; an important implication of this is that the financial support it receives from the United Kingdom and other official aid donors are classified as Official Development Assistance.
Table 4. Gross National Income, 2018/19 to 2022/23
18/19
19/20
20/21
21/22
22/23
Current market prices (£ million)
38,500
37,730
38,970
39,320
39,470
Per capita, current prices, £
8,200
8,270
8,810
8,890
9,100
Per capita, current prices, $
10,770
10,540
11,520
12,150
10,960
World Bank high income threshold $
12,375
12,535
12,695
13,205
13,845
Notes and Methodology
Revisions: Estimates for all previous years from 2017/18 onwards have been revised slightly in this release. GDP estimation and measurement methods are complex and development of St Helena’s National Accounts is an ongoing programme of work. All estimates published in this bulletin should be considered provisional and subject to future revision as additional data sources become available and further improvements are made to the methodology.
Approach: There are three basic methods of compiling total GDP: the expenditure, income, and production (or output) approaches. Prior to 2016, St Helena published estimates based on the expenditure approach, and in 2016 a figure for 2014/15 was published based on the income approach. This Bulletin presents estimates based on the production approach. As far as practicable in a small economy with limited resources for compiling GDP statistics, the methods used aim to follow the international guidance published in the 2008 System of National Accounts by the United Nations.
GDP at basic prices: Estimates at basic prices are derived as the sum of the gross value added of companies and government consumption expenditure, plus the incomes of sole traders, and an estimate of the rental value derived by households from the owner-occupation of their homes. The valuation of the output of government has been made on a net basis, excluding an estimate of asset depreciation (this is common in other small countries). Taxes on production are small and have not generally been included, so the value of GDP at basic prices is roughly equivalent to factor cost.
GDP at market prices: To be consistent with the guidelines issued by the United Nations, GDP at market prices is derived by adding total indirect taxes on products and production (including customs duties and service taxes) to total GDP at basic prices, and subtracting regular government subsidies to companies (currently, this comprises the subsidies paid to Connect Saint Helena Limited and St Helena Airport Limited).
Inflation adjustment: Estimates are presented in both nominal and real terms, referred to in this release as current prices and constant 2022/23 prices. Estimates in nominal terms will change due to both the effect of price changes and because of growth in the size of the economy. But changes in the size of the economy can only be measured using estimates expressed in real terms, adjusted for price inflation. Estimates in real terms have been calculated by applying the recommended method of using specific inflation estimates for each industrial grouping of economic activity, an improvement on past practice of using St Helena’s Retail Price Index.
Measurement issues: There are significant measurement difficulties in obtaining accurate source data for estimating GDP and related indicators for St Helena. Additionally the recommended measurement frameworks and concepts are not always well suited to measuring economic activity in small, aid-dependent economies. Estimates are very sensitive to timing issues and to recording or classification conventions, which while appropriate for larger economies may distort trends and levels in smaller countries. There are further measurement difficulties in calculating GNI; in particular, there are very limited data sources to estimate the income earned abroad by resident individuals and companies and the income earned on St Helena by non-resident individuals and companies.
Per capita estimates: For calculating per capita estimates of GDP and GNI, the population total used is the average of the end of month on-Island population estimates for the period, as published on the St Helena Government website by the Statistics Office.
Currency conversion: For converting from St Helena Pounds (£) to United States Dollars ($), the average monthly spot rates published by the Bank of England have been used for each financial year.
Data sources: The primary sources that have been used to compile GDP and related measures include Income Tax returns, published company accounts, and population estimates published by the Statistics Office. Thanks are extended to all the companies and businesses that have responded to past Business Surveys, to the Income Tax Office for their cooperation and help in using the data from tax returns for this purpose, and to the Immigration Office for their help in using data on arrivals and departures to estimate the size of the population. Data confidentiality is maintained in accordance with the requirements of the 2000 Statistics Ordinance.
Technical advice and support: Compiling estimates of Gross Domestic Product and related National Accounts is a highly specialised task that has only been possible because of the technical advice and support provided by the Office of National Statistics (ONS) Methodology Advisory Service in the United Kingdom – thanks are especially due to Jim O’Donoghue and Robin Youll.
Have more questions or comments?
Please get in touch: we are Neil Fantom, Chief Statistician, Kelly Clingham and Justine Joshua, Senior Statistical Assistants, and Courtney O’Dean, Statistics Assistant. You can find us in person at the Statistics Office on the top floor of the Post Office Building, Jamestown. You can also contact us by telephone on 22138; if calling from overseas, the international dialling code for St Helena is 290. Our general office e-mail address is statistics@sainthelena.gov.sh, or you can email team members directly (the format is firstname.lastname@sainthelena.gov.sh).
The latest provisional estimates have been released for the numbers of passenger arrivals and departures to and from St Helena.
Arrivals
In July 2024, there were an estimated 238 arrivals, with 212 arriving by air. 96 people arrived for leisure, including 23 non-St Helenians and 73 St Helenians visiting family and friends on the island. 26 people arrived by yacht or ship. During the last 12 months (August 2023 to July 2024) there have been 4,324 arrivals, compared to 3,955 in the same period a year ago – a 9.3% increase. Of those arrivals, 2,008 were for a leisure purpose, this is 14.0% more than the same period in the previous year when arrivals for leisure purposes totalled 1,762.
https://datawrapper.dwcdn.net/EA4bJ/25
Departures
In July 2024 there were an estimated 274 departures from the island, 36 more than the number of arrivals. 253 left by air with the remaining 21 leaving by sea. During the last 12 months (August 2023 to July 2024), there were a total of 4,371 departures, compared to 3,990 in the same period a year ago – an increase of 9.5%, and 47 more than the number of arrivals.
https://datawrapper.dwcdn.net/KlqTH/19
Get the data
A file in Excel format with detailed monthly statistics on arrivals and departures to July 2024 can be downloaded here.
The St Helena Statistics Office has released a report and an accompanying data file containing the results from the 2023 Household Expenditure Survey (HES). The survey was conducted between August and November 2023 and was designed to provide an updated estimate of the average weekly consumption expenditure of households, or ‘shopping basket’ for short, for the Consumer Price Index (CPI – formerly known as the Retail Price Index, or RPI), which in turn measures price inflation.
119 completed survey questionnaires were obtained, or roughly one for every 16 households on St Helena. The new price of the average weekly shopping basket of resident households is estimated to be £255, which is almost the same as the basket from the 2017 survey, when price inflation is taken into account and other adjustments are made for comparability (these include the removal of loan principal repayments and house construction costs from the basket, in line with the latest international recommendations for price indices).
Detailed changes to the composition of the average weekly shopping basket are relatively small when compared to 2017; eighteen new categories of expenditure have been added, and fifteen existing categories have been discontinued. The detailed weighting patterns of different categories reflect the changes that have occurred in St Helena’s economy since 2017, including the new international freight shipping service, the establishment of a scheduled weekly air transport service to South Africa, the impact of the COVID-19 pandemic, improvements in communications technology, and price increases caused by rising fuel costs. The new basket will be used as the basis for the CPI from the third quarter of 2024.
The 2023 HES was a significant effort and sincere thanks are extended to the households who participated, to the enumerators who visited all the households, and to all others who supported it and made it a success.
The St Helena Statistics Office has released new provisional estimates of the number of people on St Helena by age, sex, residency and nationality, and the number of births and deaths.
At the end of June 2024 there were an estimated 4,139 people on the island, a decrease of 54 from the end of May, when there were an estimated 4,193. Of the people on the island, an estimated 4,034 people were residents, and 105 were visitors. This compares to an estimated 4,059 residents on the island at the end of May, and 4,137 residents on the island a year ago, at the end of June 2023.
https://datawrapper.dwcdn.net/BKVr4/29
Compared to a year ago at the end of June 2023 there has been a decrease in the number of resident children on-island (0-14 years) and those of roughly working age (15-64 years), by 33 and 93 respectively, but an increase of the number of those 65 and over, by 23. As a result the Old Aged Dependency Ratio of the resident on-island population (the number of those 65 and over compared to those of roughly working age) has increased to 48.1 at the end of June 2024, compared to June 2023 when it was estimated to be 45.3.
The chart illustrates the estimated St Helenian resident population at the end of June 2024 by five-year age groups and sex. The age group with the smallest number of St Helenians is 20-24 (124), followed closely by 0-4 (127); the age group with the most is 60-64, with 345 people.
https://datawrapper.dwcdn.net/1Wutc/6
A data file with monthly population estimates to the end of June 2024 can be downloaded here. The file includes population totals by age, sex, residency and nationality, and the number of arrivals, departures, births, and deaths.
The latest provisional estimates have been released for the numbers of passenger arrivals and departures to and from St Helena.
Arrivals
In June 2024, there were an estimated 196 arrivals, with 184 arriving by air. 76 people arrived for leisure, including 41 non-St Helenians and 35 St Helenians visiting family and friends on the island. 12 people arrived by yacht or ship. During the last 12 months (July 2023 to June 2024) there have been 4,345 arrivals, compared to 3,955 in the same period a year ago – a 9.9% increase. Of those arrivals, 2,045 were for a leisure purpose, this is 16.9% more than the same period in the previous year when arrivals for leisure purposes totalled 1,749.
https://datawrapper.dwcdn.net/EA4bJ/24
Departures
In June 2024 there were an estimated 249 departures from the island, some 53 more than the number of arrivals. 232 left by air with the remaining 17 leaving by sea. During the last 12 months (July 2023 to June 2024), there were a total of 4,424 departures, compared to 3,929 in the same period a year ago – an increase of 12.6%, and 79 more than the number of arrivals.
https://datawrapper.dwcdn.net/KlqTH/18
Get the data
A file in Excel format with detailed monthly statistics on arrivals and departures to June 2024 can be downloaded here.
Latest index value and inflation rates for Q2 2024
The Statistics Office has released new estimates of the Retail Price Index (RPI) and the annual inflation rate for Q2, 2024. For the second quarter of 2024 the RPI has been measured at 117.3; in Q2 2023 the RPI was 115.3, resulting in an annual inflation rate of 1.8%. This rate is unchanged from the previous annual inflation rate of Q1 2024.
https://datawrapper.dwcdn.net/qu053/4
Trends in price changes
The index uses 203 representative items to measure price changes in nine different major categories of household spending. Since a year ago, 85 items increased in price, 39 items decreased in price, and the price of 79 items remained unchanged. All categories saw an increase in price since a year ago (Q2 2023), apart from the Communications category, which saw a significant drop in price due to changes in the internet access tariffs introduced by the telecommunications provider (Sure) in October last year. This price drop continues to partly offset price increases in other categories, when measured over a one year period.
Price changes in both the UK and South Africa have a strong impact on prices on St Helena, since the majority of goods imported are purchased in those two countries. In May 2024, annual consumer price inflation in the UK was measured at 2.0% (UK Office for National Statistics), down from 2.3% in April, and in South Africa it was measured at 5.2% (Statistics South Africa), unchanged from April 2024. Changes in the value of the Rand compared to the Pound can have a large effect on the price of goods purchased in South Africa, and during the first six months of 2024 the Pound averaged around 23.7 Rand, which is a 5% increase compared to the same period in 2023, when it was 22.5. This change tends to counteract the effect of price inflation in South Africa on the final shop-floor prices on St Helena.
https://datawrapper.dwcdn.net/iyYbU/24
Price changes by category
The categories which contributed the most to the upward pressure in the 1.8% annual inflation rate are Household Energy, Housing and Transport. In January 2024 Connect Saint Helena Ltd introduced a revised Utilities tariff, with an increase in charges for both water and electricity; further price increases have been introduced in July 2024, but these will only be measured in the next quarter (Q3 2024). Over the last twelve months the Housing category has been affected by increases in the price of water, the price of building materials and maintenance services, and the Transport category has risen mostly due to increases in prices of tyres, delivery charges, and petrol and diesel.
https://datawrapper.dwcdn.net/HCa38/17
The quarterly change in the RPI was 0.3% (i.e. Q2 2024 compared to Q1 2024). The three categories with the highest increases over the last quarter were Food (1.0% increase on average), Transport (0.8% increase on average), and Miscellaneous Goods and Services (0.6% change on average). There were price decreases in Household Goods and Services (-1.0% change on average) and Clothing (-12.0% change on average). Clothing prices are relatively volatile as they are often affected in the short term by store stock changes, but clothing has a very low weight in the shopping basket (1.1%) so these changes have a relatively small impact on the overall average inflation rate.
https://datawrapper.dwcdn.net/mDrpa/1
Frequently Asked Questions
What is price inflation and how is it measured?
Price inflation is the change in the average prices of goods and services over time. The rate of price inflation is calculated from the change in the RPI, which is the official measure of the average change in the prices of goods and services paid by consumers. The RPI is estimated each quarter, i.e. once every three months, and the rate of price inflation is usually quoted on an annual basis; that is, comparing price changes over a 12-month period. Prices and the RPI tend to go up, but they can occasionally go down – which is known as price deflation.
The RPI is a statistical measure of the change in retail prices on St Helena; an increase in the RPI means that, on average, prices have gone up since the last time they were measured, and a decrease in the RPI means that, on average, prices have fallen. The annual change in the RPI is called the annual inflation rate, and is the usual measure of the change in prices in an economy. The RPI is an average measure: if it goes up, it does not mean that all prices have gone up, and similarly, if it goes down, it does not mean that all prices have fallen.
Why do we measure inflation?
An accurate measure of price inflation helps understand the extent and nature of the impact of price changes on the government, businesses, households and individuals. Inflation rates are often used in budgeting and accounting processes so that costs can be adjusted for the effect of price changes.
How is the RPI calculated?
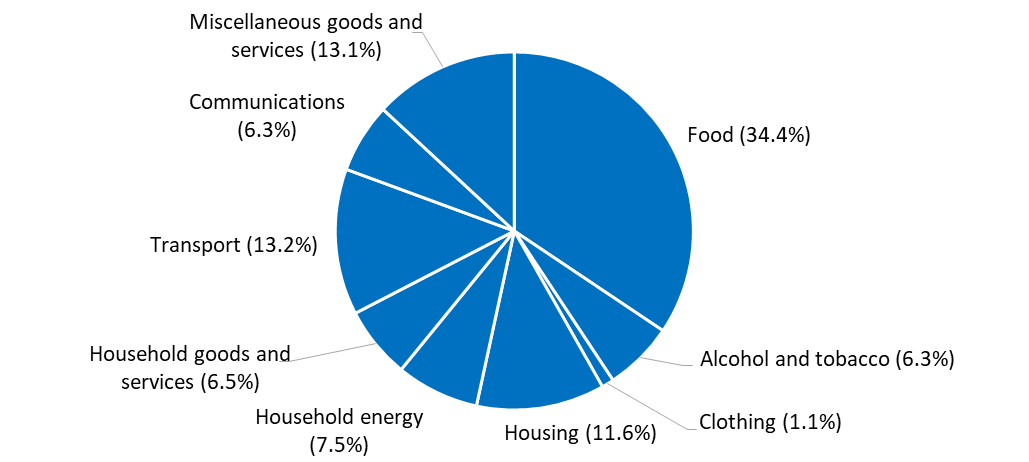
The basis for the RPI is the average weekly cost of goods and services purchased by households on St Helena, sometimes called the RPI ‘shopping basket’. Items which households purchase more of, such as food, have the biggest share of the RPI basket. The current RPI uses a basket from the latest Household Expenditure Survey in 2017; prices representing the groups of items in the basket are collected every quarter, and the price of the total basket is compared to the price in the baseline period, the first quarter of 2018. By convention, the value of the basket in the baseline period is scaled to 100, and the RPI values are quoted in relation to that baseline. For example, an RPI value of 120 means that average prices have increased by 20 per cent compared to those recorded in the baseline period.
Composition of average household weekly expenditure (Q1 2018 RPI ‘Shopping Basket’)
What happens when items are not available?
If an item of the ‘basket’ is not available then either the previous price will be carried forward from the previous quarter, or a suitable substitute item will be identified and an adjustment calculation made. Care is taken to ensure that this substitute item represents the item category and that it does not introduce error to the measurement of the RPI. An important principle is that price changes should reflect actual price increases and decreases, and not changes in the quality of items.
Please get in touch. We are Neil Fantom, Statistical Commissioner, Kelly Clingham and Justine Joshua, Senior Statistical Assistants and Courtney O’Dean, Statistics Assistant. You can find us in person at the Statistics Office on the top floor of the Post Office, Jamestown. You can also contact us by telephone on our direct line through 22138. If calling from overseas, the international dialling code for St Helena is +290. Our general office e-mail address is statistics@sainthelena.gov.sh, or you can email team members directly (the format is firstname.lastname@sainthelena.gov.sh).
The St Helena Statistics Office has released new estimates for the total population of St Helena, and the number of births and deaths. Please note that these population estimates are provisional.
At the end of May 2024 there were an estimated 4,193 people on the island, a decrease from the end of April, when there were an estimated 4,223. Of the people on the island, an estimated 4,059 people were residents, and 134 were visitors. This compares to an estimated 4,073 residents on the island at the end of April, and 4,148 residents on the island a year ago, at the end of May 2023.
https://datawrapper.dwcdn.net/BKVr4/29
Compared to the end of May 2023 there has been a decrease in the number of resident children on-island (0-14 years) and those of roughly working age (15-64 years) by 35 and 81 respectively, but an increase in those 65 and over, by 27. As a result the Old Aged Dependency Ratio of the resident on-island population (the number of those 65 and over compared to those of roughly working age) is estimated to be 47.9 at the end of May 2024, an increase compared to May 2023, when it was estimated to be 45.2.
Get the data
A data file with monthly statistics on population estimates to the end of May 2024 can be downloaded here. The file includes population totals, arrivals, departures, births, and deaths.
The latest estimates have been released for the numbers of passenger arrivals and departures to and from St Helena. Please note that these estimates are provisional.
Arrivals
In May 2024, there were an estimated 274 arrivals, with 242 arriving by air. 101 people arrived for leisure, including 37 non-St Helenians, and 64 St Helenians visiting family and friends on the island. 32 people arrived by yacht.
During the last 12 months (June 2023 to May 2024) there have been 4,380 arrivals, compared to 3,883 in the same period a year ago – a 12.8% increase. Of those arrivals, 2,057 were for a leisure purpose, this is 349 more than the same period in the previous year (June 2022 to May 2023) when arrivals for leisure purposes totalled 1,708.
https://datawrapper.dwcdn.net/EA4bJ/23
Departures
There were an estimated 300 departures in May 2024, only 26 more than the number of arrivals. 267 left by air with the remaining 33 leaving by sea. During the last 12 months (June 2023 to May 2024), there were a total of 4,444 departures, compared to 3,854 in the same period a year ago – an increase of 15.3%.
https://datawrapper.dwcdn.net/KlqTH/16
Get the data
A file with detailed monthly statistics on arrivals and departures to May 2024 can be downloaded here (Excel format).
The St Helena Statistics Office has released new estimates for the total population of St Helena, and the number of births and deaths. Please note that these population estimates are provisional.
At the end of April 2024 there were an estimated 4,223 people on the island, a decrease from the end of March, when there were an estimated 4,276. Of the people on the island, an estimated 4,077 people were residents, and 146 were visitors. This compares to an estimated 4,116 residents on the island at the end of March, and 4,128 residents on the island a year ago, at the end of April 2023.
https://datawrapper.dwcdn.net/BKVr4/28
Compared to the end of April 2023 there has been a decrease in the number of resident children on-island (0-14 years) and those of roughly working age (15-64 years) by 16 and 70 respectively, but an increase in those 65 and over, by 35. As a result the Old Aged Dependency Ratio of the resident on-island population (the number of those 65 and over compared to those of roughly working age) is estimated to be 47.9 at the end of April 2024, an increase compared to April 2023, when it was estimated to be 45.1.
Get the data
A data file with monthly statistics on population estimates to the end of April 2024 can be downloaded here. The file includes population totals, arrivals, departures, births, and deaths.