The latest estimates have been released for the numbers of passenger arrivals and departures to and from St Helena. Please note that these estimates are provisional.
Arrivals
In April 2024, there were an estimated 352 arrivals, with 230 arriving by air. 151 people arrived for leisure, including 97 non-St Helenians, and 54 St Helenians visiting family and friends on the island. 122 people arrived by sea, the majority of whom arrived by yacht.
During the last 12 months (May 2023 to April 2024) there have been 4,393 arrivals, compared to 3,774 in the same period a year ago – a 16% increase. Of those arrivals, 2,064 were for a leisure purpose, this is 427 more than the same period in the previous year (May 2022 to April 2023) when arrivals for leisure purposes totalled 1,637.
https://datawrapper.dwcdn.net/EA4bJ/22
Departures
There were an estimated 403 departures in April 2024, only 51 more than the number of arrivals. 319 left by air with the remaining 84 leaving by sea. During the last 12 months (May 2023 to April 2024), there were a total of 4,418 departures, compared to 3,746 in the same period a year ago – an increase of 18%.
https://datawrapper.dwcdn.net/KlqTH/15
Get the data
A file with detailed monthly statistics on arrivals and departures to April 2024 can be downloaded here (Excel format).
The St Helena Statistics Office has released new estimates for the total population of St Helena, and the number of births and deaths. Please note that these population estimates are provisional.
At the end of March 2024 there were an estimated 4,279 people on the island, a decrease from the end of February, when there were an estimated 4,333. Of the people on the island, an estimated 4,119 people were residents, and 160 were visitors. This compares to an estimated 4,107 residents on the island at the end of February, and 4,188 residents on the island a year ago, at the end of March 2023.
https://datawrapper.dwcdn.net/BKVr4/27
Compared to the end of March 2023 there has been a decrease in the number of resident children on-island (0-14 years) and those of roughly working age (15-64 years) by 24 and 71 respectively, but an increase in those 65 and over, by 26. As a result the Old Aged Dependency Ratio of the resident on-island population (the number of those 65 and over compared to those of roughly working age) is estimated to be 47.2 at the end of March 2024, an increase compared to March 2023, when it was estimated to be 44.8.
Get the data
A data file with monthly statistics on population estimates to the end of March 2024 can be downloaded here. The file includes population totals, arrivals, departures, births, and deaths.
The latest estimates have been released for the numbers of passenger arrivals and departures to and from St Helena. Please note that these estimates are provisional.
Arrivals
In March 2024, there were an estimated 314 arrivals, with 267 arriving by air. 139 people arrived for leisure, including 58 non-St Helenians, and 81 St Helenians visiting family and friends on the island. 47 people arrived by sea, the majority of whom arrived by yacht.
During the last 12 months (April 2023 to March 2024) there have been 4,364 arrivals, compared to 3,606 in the same period a year ago – a 21% increase. Of those arrivals, 2,111 were for a leisure purpose, this is 628 more than the same period in the previous year (April 2022 to March 2023) when arrivals for leisure purposes totaled 1,483.
https://datawrapper.dwcdn.net/EA4bJ/21
Departures
There were an estimated 366 departures in March 2024, only 52 more than the number of arrivals. 318 left by air with the remaining 48 leaving by sea. During the last 12 months (April 2023 to March 2024), there were a total of 4,432 departures, compared to 3,507 in the same period a year ago – an increase of 26%.
https://datawrapper.dwcdn.net/KlqTH/12
Get the data
A file with detailed monthly statistics on arrivals and departures to March 2024 can be downloaded here (Excel format).
The Statistics Office has released new estimates of the Retail Price Index (RPI) and the annual inflation rate for Q1, 2024. The RPI is a statistical measure of the change in retail prices on St Helena; an increase in the RPI means that, on average, prices have gone up since the last time they were measured, and a decrease in the RPI means that, on average, prices have fallen. The annual change in the RPI is called the annual inflation rate, and is the usual measure of the change in prices in an economy. The RPI is an average measure: if it goes up, it does not mean that all prices have gone up, and similarly, if it goes down, it does not mean that all prices have fallen.
Latest RPI and annual inflation rates
For the first quarter of 2024, the RPI has been measured at 116.9; in Q1 2023 the RPI was 114.8, resulting in an annual inflation rate of 1.8%. This is 1.7 percentage points higher than the previous annual inflation rate for Q4 2023, which was 0.1%.
https://datawrapper.dwcdn.net/qu053/3/
Price changes in the last year
The Retail Price Index uses 203 representative items to measure price changes in nine different major categories of household spending. Since a year ago, 92 items increased in price, 32 items decreased in price, and the price of 79 items remained unchanged. Recently, the RPI has been affected by a drop in the price of Communications in Q4 2023, due to changes in the broadband internet and mobile telephone tariffs; by changes in the price of Transport caused by fluctuations in the price of petrol and diesel; and, in Q1 2024, by changes to Household Energy caused by increases to the price of electricity which came into effect on 1 January 2024.
https://datawrapper.dwcdn.net/iyYbU/18/
Pirce changes by category
Compared to a year ago, prices in most categories increased, especially in Clothing, Household Energy, and Housing. Household Energy and Housing were affected by price increases to the electricity and water tariffs introduced at the beginning of the year by the utility company, Connect St Helena Limited. Clothing prices often fluctuate because of relatively high stock turnover in outlets, but the category has a relatively small weight in the index. However in the overall average index many of these increases are partly offset by the drop in the price of broadband internet and mobile phone connections introduced by the telecommunications company (Sure), in October 2023.
https://datawrapper.dwcdn.net/HCa38/8/
Frequently Asked Questions
What is price inflation?
Price inflation is the change in the average prices of goods and services over time. The rate of price inflation is calculated from the change in the RPI, which is the official measure of the average change in the prices of goods and services paid by consumers. The RPI is estimated each quarter, i.e. once every three months, and the rate of price inflation is usually quoted on an annual basis; that is, comparing price changes over a 12-month period. Prices and the RPI tend to go up, but they can occasionally go down – which is known as price deflation.
Why do we measure inflation?
An accurate measure of price inflation helps understand the extent and nature of the impact of price changes on the government, businesses, households and individuals. Inflation rates are often used in budgeting and accounting processes so that costs can be adjusted for the effect of price changes.
How is the RPI calculated?
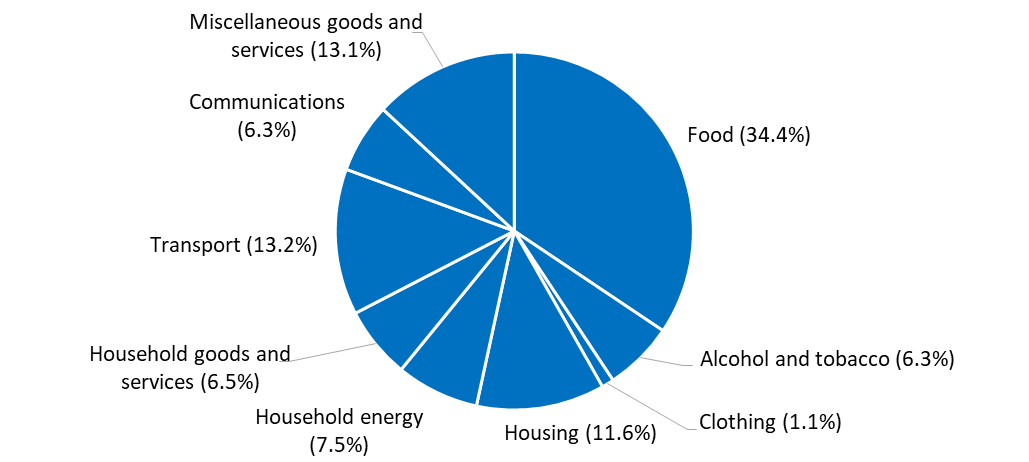
The basis for the RPI is the average weekly cost of goods and services purchased by households on St Helena, sometimes called the RPI ‘shopping basket’. Items which households purchase more of, such as food, have the biggest share of the RPI basket. The current RPI uses a basket from the latest Household Expenditure Survey in 2017; prices representing the groups of items in the basket are collected every quarter, and the price of the total basket is compared to the price in the baseline period, the first quarter of 2018. By convention, the value of the basket in the baseline period is scaled to 100, and the RPI values are quoted in relation to that baseline. For example, an RPI value of 120 means that average prices have increased by 20 per cent compared to those recorded in the baseline period.
Composition of average household weekly expenditure (Q1 2018 RPI ‘Shopping Basket’)
What happens when items are not available?
If an item of the ‘basket’ is not available then either the previous price will be carried forward from the previous quarter, or a suitable substitute item will be identified and an adjustment calculation made. Care is taken to ensure that this substitute item represents the item category and that it does not introduce error to the measurement of the RPI. An important principle is that price changes should reflect actual price increases and decreases, and not changes in the quality of items.
Please get in touch. We are Neil Fantom, Statistical Commissioner, Kelly Clingham and Justine Joshua, Senior Statistical Assistants and Courtney O’Dean, Statistics Assistant. You can find us in person at the Statistics Office on the top floor of the Post Office, Jamestown. You can also contact us by telephone on our direct line through 22138. If calling from overseas, the international dialling code for St Helena is +290. Our general office e-mail address is statistics@sainthelena.gov.sh, or you can email team members directly (the format is firstname.lastname@sainthelena.gov.sh).
This Statistical Bulletin releases new estimates of gross annual incomes of full-time employees (i.e. wages) for the 2022/23 financial year, with comparable estimates for previous years from 2013/14 onwards. To download a PDF version of this Bulletin, please click here.
These estimates measure gross before-tax incomes of persons in regular full-time employment on St Helena, reported through the Pay-As-You-Earn tax collection system. They exclude company and self-employment incomes, incomes of Technical Cooperation (TC) Officers of the St Helena Government, investment income, Income Related Benefits, incomes from pensions (including the Basic Island Pension), and part-time and part-year incomes, all as far as they can be identified in the dataset. All annual estimates are rounded to the nearest £10.
Median wage levels, adjusted for inflation
The median annual wage on St Helena in 2022/23 was an estimated £9,970. When price inflation is taken into account, this is just 0.1% higher than the median wage in 2021/22 (Chart 1).
Chart 1. Annual gross wages from full-time employment: median and upper and lower quartiles, 2013/14 to 2022/23 (inflation-adjusted 2022/23 prices)
The median is the usual measure of average incomes or wages because it is less sensitive to small numbers of relatively high wage earners in a population than the mean, which is the more common method used in other statistics. A median wage level of £9,970 means that, for 2022/23, half the people earning wages from non-TC employment had gross wages that were less than £9,970 and half had gross wages that were higher.
Wage level range
Chart 1 also shows the upper and lower quartiles; the lower quartile is the point at which a quarter of wages are lower, and the upper quartile is the point at which a quarter of wages are higher; half of all employment wages lie between the lower and upper quartiles. For 2022/23 half of all full-time employees earned between £8,110 and £13,200. The gap between the upper and lower quartiles is still smaller in 2022/23 than in 2014/15 and 2015/16, likely the result of a number of relatively higher paid workers leaving the workforce when St Helena’s Airport was completed.
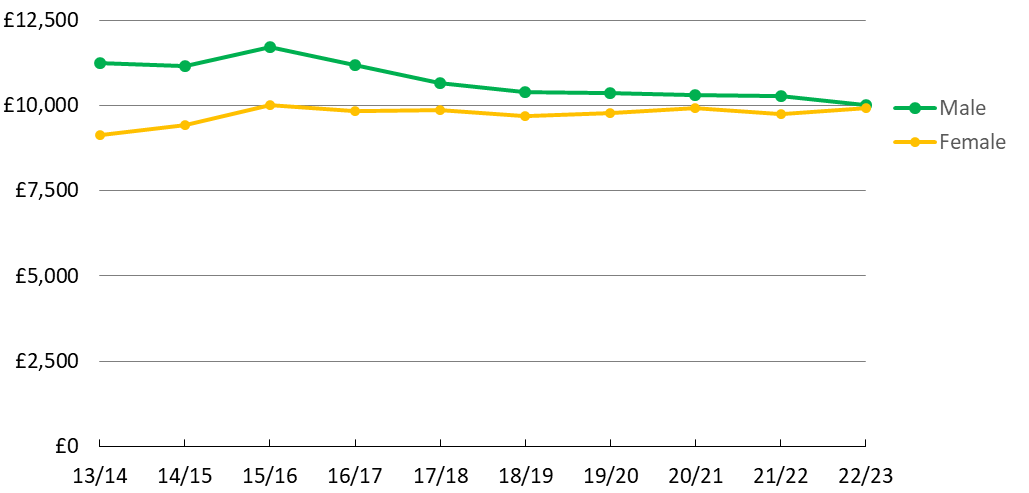
Differences in wage levels between women and men
Chart 2 shows inflation-adjusted median wages from employment broken down by male and female employees, between 2013/14 and 2022/23. For every year, the male median wage has been higher than the female median wage, but the gap between the two has narrowed in recent years, and has almost disappeared in 2022/23. In part this is due to the completion of the new Airport; construction workers employed were predominantly male, relatively higher paid, and many of them have since either left St Helena or found alternative lower paid employment.
Chart 2. Median real gross annual wages from employment, male and female 2013/14 to 2022/23, in constant 2022/23 prices (i.e. adjusted for inflation)
Average wage levels by occupation
Employees have been classified into their main occupational grouping using the International Standard Classification of Occupations published by the United Nations (International Labour Organisation). Chart 3 shows estimates of median wages in each of these major groupings, for 2022/23, excluding TC Officers.
The groups of occupations with the highest wages, on average, were Managers, Professionals, and Technicians and Associate Professionals. These groups accounted for 508 employees, or 31% of non-TC employees. The occupations with the lowest wages, on average, were Skilled Agricultural, Forestry and Fishery Workers, Services and Sales workers, and Elementary Occupations (this group includes unskilled labourers). These groups accounted for 724 employees, or 44% of non-TC Officers.
Chart 3. Median gross annual wages from employment by occupational grouping, 2022/23
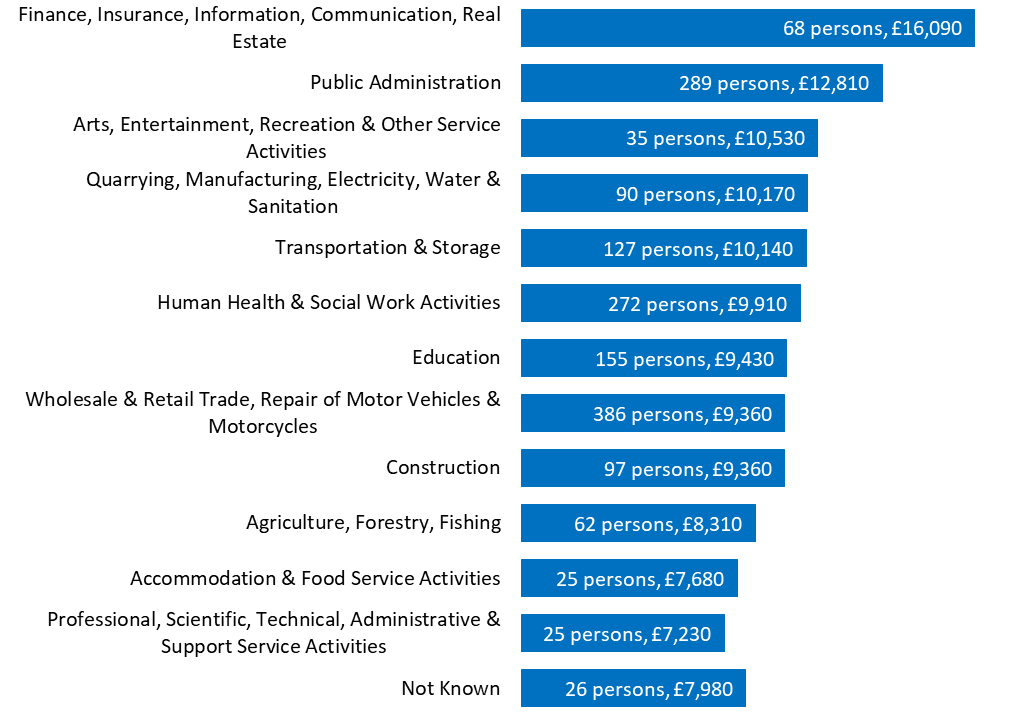
Average wage levels by industry
Employees have been classified into their main industry grouping using the International Standard Industrial Classification published by the United Nations. Chart 4 shows estimates of median wages in each major grouping, for non-TC employees.
In 2022/23 the groups of industries with the highest wages, on average, were Finance, Insurance, Information, Communication and Real Estate, and Public Administration. The industries with the lowest wages, on average, were Professional, Scientific, Technical, Administrative and Support Service Activities, and Accommodation and Food Service Activities.
Chart 4. Median gross annual wages from employment by industry, 2022/23
Numbers of persons in full-time employment
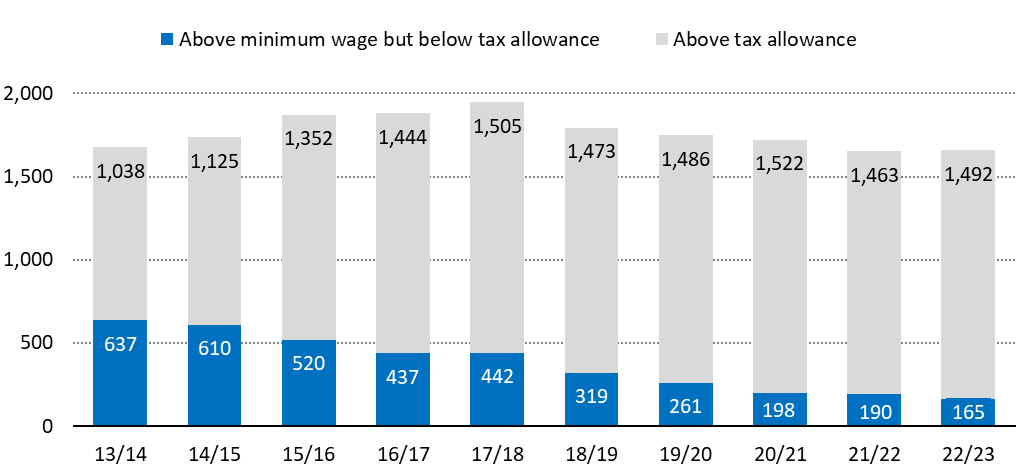
Chart 5 shows the number of persons with wages from full-time employment above and below the income tax allowance, excluding TC officers (personal income below the income tax allowance is not subject to income tax).
The total estimated number of persons with wages from full-time employment rose to 1,947 in 2017/18, the year when the new airport was opened and most construction activities were completed. Since then, the number has tended to fall slightly each year; in 2021/22, there were an estimated 1,653 persons with wages from full-time employment, although in 2022/23 there was a very slight increase, to 1,657.
The number of full-time employees above the income tax allowance of £7,000 also increased in 2022/23, to 1,492, 29 people more than 2021/22, and only 13 people less than the highest number recorded in 2017/18 (1,505). The number of people earning more than the minimum wage but not earning enough to pay income tax fell to 165 in 2022/23.
Chart 5. Number of employees in full-time employment, 2013/14 to 2022/23
Get the data
The complete set of statistics on average gross incomes from employment from 2013/14 to 2022/23 is available here. For more statistical data on the St helena Economy, see sainthelena.gov.sh/statistics.
Methodology
Data source. Statistics on wages and incomes on St Helena are derived from a computerised database maintained by the Income Tax Office, which captures information about all wage earners whose details are submitted through the Pay-As-You-Earn (PAYE) system. There are some limitations when using this database as a source for estimating incomes; for example, informal income earned may not be declared; it is difficult to distinguish full-time and part-time workers and full-year and part-year incomes; and some reported incomes may include second jobs.
Gross income (wages) from employment. The primary analysis in this Bulletin uses average gross incomes from employment, also referred to as wages. Income from investments (including employer pension schemes) and from self-employment, benefits, or the Basic Island Pension is excluded, as far as they can be identified. Incomes are gross, that is, before any tax is deducted, and all published estimates are rounded to the nearest £10 (calculations of constant price estimates are made on the unrounded estimates and growth rate calculations are made using the rounded estimates). Only incomes that are high enough to represent full-time employment from a 35 hour working week are included.
Median. The median is a measure of the average value of a set of numbers. It is the ‘middle number’ in a ranked list, the value at which exactly half the population has a smaller value and half has a higher value. It is preferred to the mean when estimating average incomes or wages, since it is less easily ‘skewed’ by a few individuals with relatively large incomes.
Mean. The mean is a measure of the average value of a set of numbers; it is derived by adding all the numbers together, and dividing by the number of values in the dataset. While it is the most common measure of the average for many applications, it can produce misleading results for estimating average incomes because it can be biased by small numbers of relatively high incomes.
Adjusting for inflation. Most of the average income estimates are adjusted for the impact of price inflation, using St Helena’s Retail Price Index to estimate relevant statistics in 2022/23 prices. Inflation-adjusted estimates are called ‘constant’ or ‘real’; unadjusted estimates are called ‘nominal’ or ‘current’. Inflation-adjustment makes comparisons over time more meaningful, since any change up or down shows whether a person has more or less purchasing power. For example, the median nominal gross income for 2013/14 was £7,890 per year. But prices were not the same in 2022/23 as they were in 2013/14; an employee would need to have earned £10,270 a year to buy the same amount of goods and services in 2022/23 that they could buy in 2013/14 with £7,890. So £10,270 is the average gross income in 2013/14 stated in 2022/23 prices.
Eliminating part-year and part-time incomes. A lower bound threshold is set to try to ensure that part-time or under-reported incomes are excluded from the analysis as far as possible; the threshold is set using the Minimum Wage for a 35 hour week. Incomes that were assessed for income tax using an allowance of half a year or less have also been excluded.
Exclusion of Technical Cooperation Officers from the analysis. Technical Cooperation Officers are persons employed by St Helena Government following international recruitment as a result of limited labour availability in particular occupations on the Island; in 2022/23, 92% of them were Managers, Professionals or Associate Professionals, or Technicians, and 97% of them worked in Public Administration, Human Health and Social Work, or Education. They are employed for a fixed period of time on internationally competitive pay scales and terms and conditions which differ from those recruited locally on St Helena. As such, their incomes are not typical and so are excluded from the main statistics on incomes.
Contact us and find out more
The team at the Statistics Office currently comprises Neil Fantom, Statistical Commissioner, Kelly Clingham and Justine Joshua, Senior Statistical Assistants, and Courtney O’Dean, Statistics Assistant. Please visit us in person; the Statistics Office is on the second floor of the Post Office, Jamestown. Call by, we would love to see you! You can also contact us by telephone: our direct line is 22138. If calling from overseas, the international dialling code for St Helena is +290. Our general office email address is: statistics@sainthelena.gov.sh, or you can email team members directly (the format is firstname.lastname@sainthelena.gov.sh).
For more statistical data and reports, covering many aspects of St Helena’s social and economic development, please visit us on the web: www.sainthelena.gov.sh/st-helena/statistics.
The St Helena Statistics Office has released new estimates for the total population of St Helena, and the number of births and deaths. Please note that these population estimates are provisional.
At the end of February 2024 there were an estimated 4,332 people on the island, a decrease from the end of January, when there were an estimated 4,386. Of the people on the island, an estimated 4,120 people were residents, and 212 were visitors. This compares to an estimated 4,101 residents on the island at the end of January, and 4,192 residents on the island a year ago, at the end of February 2023.
https://datawrapper.dwcdn.net/BKVr4/26/
Compared to the end of February 2023 there has been a decrease in the number of resident children on-island (0-14 years) and those of roughly working age (15-64 years) by 21 and 76 respectively, but an increase in those 65 and over, by 25. As a result the Old Aged Dependency Ratio of the resident on-island population (the number of those 65 and over compared to those of roughly working age) is estimated to be 47.3 at the end of February 2024, an increase compared to February 2023, when it was estimated to be 44.9.
Get the data
A data file with monthly statistics on population estimates to the end of February 2024 can be downloaded here. The file includes population totals, arrivals, departures, births, and deaths.
The latest estimates have been released for the numbers of passenger arrivals and departures to and from St Helena. Please note that these estimates are provisional.
Arrivals
In February 2024, there were an estimated 458 arrivals, with 343 arriving by air. 234 people arrived for leisure, including 177 non-St Helenians, and 57 St Helenians visiting family and friends on the island. 115 people arrived by sea, all of whom arrived by yacht.
During the last 12 months (March 2023 to February 2024) there have been 4,427 arrivals, compared to 3,522 in the same period a year ago – a 26% increase. Of those arrivals, 2,166 were for a leisure purpose, this is just under 800 more than the same period in the previous year (March 2022 to February 2023) when arrivals for leisure purposes totaled 1,370.
https://datawrapper.dwcdn.net/EA4bJ/20/
Departures
There were an estimated 507 departures in February 2024, only 49 more than the number of arrivals. 380 left by air with the remaining 127 leaving by sea. During the last 12 months (March 2023 to February 2024), there were a total of 4,449 departures, compared to 3,493 in the same period a year ago – an increase of 27%.
https://datawrapper.dwcdn.net/KlqTH/11/
Get the data
A file with detailed monthly statistics on arrivals and departures to February 2024 can be downloaded here (Excel format).
We welcome comments and suggestions on any of the statistics published by the Statistics Office. Please email: statistics@sainthelena.gov.sh, call tel: 22138, or visit the office in person on the top floor of the Post Office Building, Jamestown.
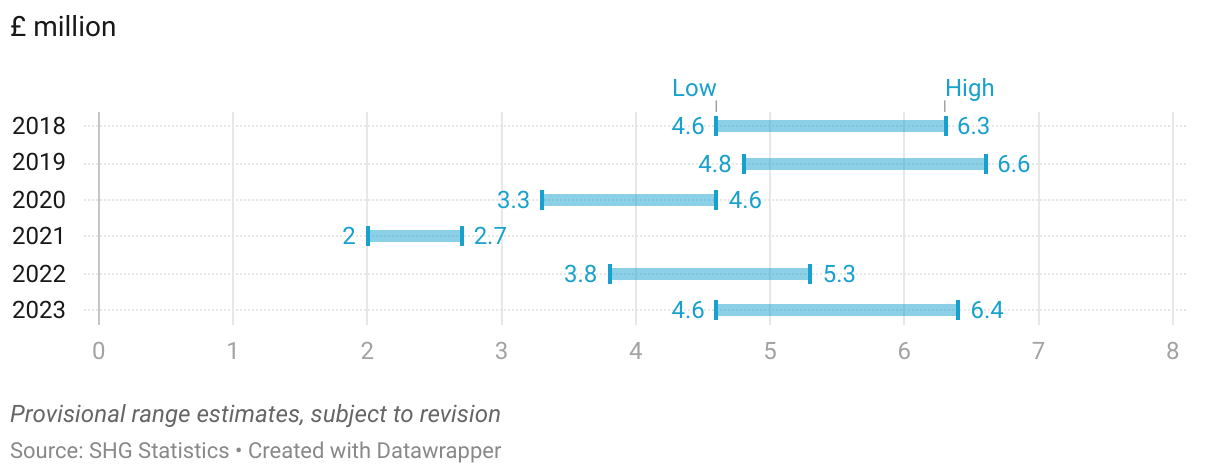
The Statistics Office has released new provisional range estimates of the expenditure of visitors for 2023, of between £4.6 and £6.4 million. This is roughly the same as in 2018, and only slightly lower than 2019, the year directly before the COVID-19 pandemic, which was between £4.8 and £6.6 million.
Note that the exports of St Helena consist of both goods and services purchased by those that are not normally living on the island. The value of services provided to visitors to the island is currently far greater than the total value of the exports of goods, such as fish and coffee. Visitor expenditire estimates are based on estimates of the daily expenditures of different categories of visitors, and their length of stay on St Helena; the estimates derived from this method are not precise, and so they are given as a range to indicate that their uncertainty.
Download the full set of statistics on external trade, including goods imports and exports and visitor expenditures, here.
The St Helena Statistics Office has released new estimates for the total population of St Helena, and the number of births and deaths. Please note that these population estimates are provisional.
At the end of January 2024 there were an estimated 4,388 people on the island, a decrease from the end of December, when there were an estimated 4,586. Of the people on the island, an estimated 4,118 people were residents, and 270 were visitors – more than one in every ten. This compares to an estimated 4,096 residents on the island at the end of December, and 4,215 residents on the island a year ago, at the end of January 2023.
https://datawrapper.dwcdn.net/BKVr4/25/
Compared to the end of January 2023 there has been a decrease in the number of resident children on-island (0-14 years) and those of roughly working age (15-64 years) by 31 and 89 respectively, but an increase in those 65 and over, by 23. As a result the Old Aged Dependency Ratio of the resident on-island population (the number of those 65 and over compared to those of roughly working age) is estimated to be 47.1 at the end of January 2024, an increase compared to January 2023, when it was estimated to be 44.5.
Get the data
A data file with monthly statistics on population estimates to the end of January 2024 can be downloaded here. The file includes population totals, arrivals, departures, births, and deaths.