The latest estimates have been released for the numbers of passenger arrivals and departures to and from St Helena. Please note that these estimates are provisional.
Arrivals
In January 2024, there were an estimated 625 arrivals, with 449 arriving by air. 237 people arrived for leisure, including 147 non-St Helenians, and 90 St Helenians visiting family and friends on the island. This is the highest number of non-St Helenian leisure visitors since February 2020 (250). 176 people arrived by sea, including 174 people by yacht. Yacht arrivals in January 2024 included participants in the World ARC Rally whose second route from Australia called at St Helena on their way to Brazil.
During the last 12 months (February 2023 to January 2024) there have been 4,362 arrivals, compared to 3,297 in the same period a year ago – a 32% increase. Of those arrivals, 2,135 were for a leisure purpose, this is just over 900 more than the previous 12 month period (February 2022 to January 2023) when arrivals for leisure purposes totaled 1,217.
https://datawrapper.dwcdn.net/EA4bJ/19/
Departures
There were an estimated 819 departures in January 2024, 194 more than the number of arrivals. 668 left by air with the remaining 151 leaving by sea. During the last 12 months (February 2023 to January 2024), there were a total of 4,381 departures, compared to 3,270 in the same period a year ago – an increase of 34%.
https://datawrapper.dwcdn.net/KlqTH/10/
Get the data
A file with detailed monthly statistics on arrivals and departures to January 2024 can be downloaded here (Excel format).
New statistical updates have been released for the Population of Ascension and Tristan Da Cunha on January 31, 2024. The latest data file is here, with estimates of the Ascension population to Q4, 2023, and Tristan da Cuhna to Q2, 2023.
Additional statistical series and indicators are available at https://www.sainthelena.gov.sh/st-helena/statistics/. We welcome comments and suggestions on any of the statistics published by the Statistics Office. Please email: statistics@sainthelena.gov.sh, call tel: 22138, or visit the office in person on the top floor of the Post Office Building, Jamestown.
The St Helena Statistics Office has released new estimates for the total population of St Helena, and the number of births and deaths. Please note that these population estimates are provisional.
At the end of December 2023 there were an estimated 4,586 people on the island, an increase from the end of November, when there were an estimated 4,293. Of the people on the island, an estimated 4,101 people were residents, and 485 were visitors – more than one in every ten. This compares to an estimated 4,100 residents on the island at the end of November, and 4,193 residents on the island a year ago, at the end of December 2022.
https://datawrapper.dwcdn.net/BKVr4/23/
Compared to the end of December 2022 there has been a decrease in the number of resident children on-island (0-14 years) and those of roughly working age (15-64 years) by 42 and 79 respectively, but an increase in those 65 and over, by 29. As a result the Old Aged Dependency Ratio of the resident on-island population (the number of those 65 and over compared to those of roughly working age) is estimated to be 47.0 at the end of December 2023, an increase compared to December 2022, when it was estimated to be 44.4.
Get the data
A data file with monthly statistics on population estimates to the end of December 2023 can be downloaded here. The file includes population totals, arrivals, departures, births, and deaths.
The latest estimates have been released for the numbers of passenger arrivals and departures to and from St Helena. Please note that these estimates are provisional.
Arrivals
In December 2023, there were an estimated 641 arrivals, with 613 arriving by air. 497 people arrived for leisure, including 99 non-St Helenians, and 398 St Helenians visiting family and friends on the island, many for the Christmas period. This is a very high number of St Helenians visiting family and friends, lower by just three than the highest recorded recently, which was 401 in December 2019.
During the whole of 2023 there have been 4,337 arrivals, compared to 2,968 in the same period of 2022 – a 46.1% increase. Of those arrivals, 2,110 were for a leisure purpose, just under a thousand more than the number in the same period in 2022 (1,117), when COVID19 quarantine precautions were still in place.
https://datawrapper.dwcdn.net/EA4bJ/18/
Departures
There were an estimated 347 departures in December 2023, 294 less than the number of arrivals; of these, 324 left by air. During 2023, there were a total of 4,194 departures, compared to 3,002 in the same period in 2022 – an increase of 39.7%.
https://datawrapper.dwcdn.net/KlqTH/9/
Get the data
A file with detailed monthly statistics on arrivals and departures to December 2023 can be downloaded here (Excel format).
Estimates of the Retail Price Index and price inflation rates have been calculated for the fourth quarter of 2023. The data released in this Bulletin can be downloaded in Excel format here, and a PDF version of this Bulletin can be downloaded here. More statistics on St Helena’s economy can be found here.
About the Retail Price Index and the Inflation Rate
The Retail Price Index (RPI) is a statistical measure of the change in retail prices on St Helena. An increase in the RPI means that, on average, prices have gone up since the last time they were measured, and a decrease in the RPI means that, on average, prices have fallen. The annual change in the RPI is called the annual inflation rate, and is the usual measure of the change in prices in an economy. It is important to understand that the RPI is an average measure: if it goes up, it does not mean that all prices have gone up, and similarly, if it goes down, it does not mean that all prices have fallen.
Latest index value and inflation rates
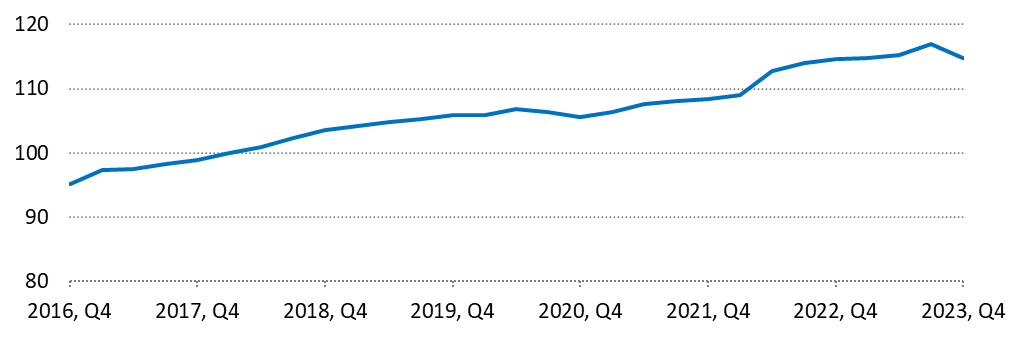
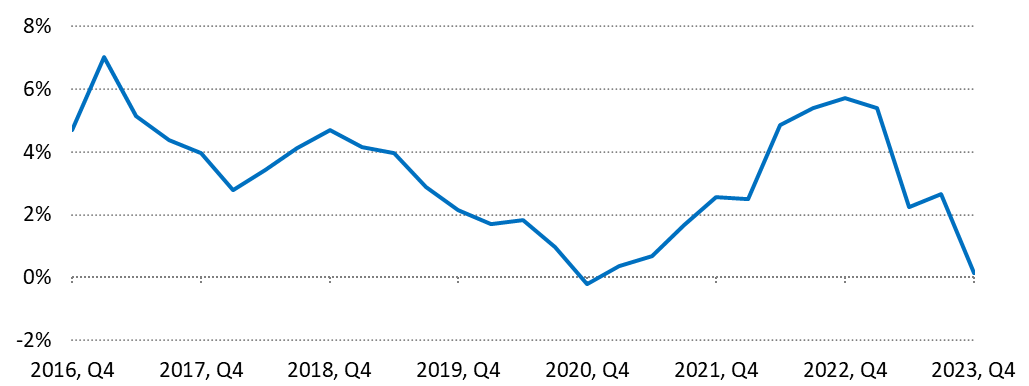
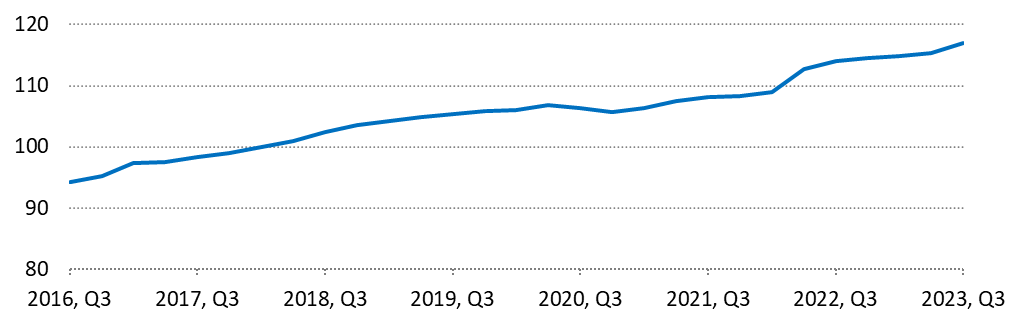
For the fourth quarter of 2023 the RPI has been measured at 114.7 (Chart 1). In Q4 2022, the RPI was 114.5, resulting in an annual inflation rate of 0.1%. This is 2.6 percentage points lower than the previous annual inflation rate for Q3 2023, which was 2.7%.
Chart 1. Retail Price Index, Q4 2016 to Q4 2023
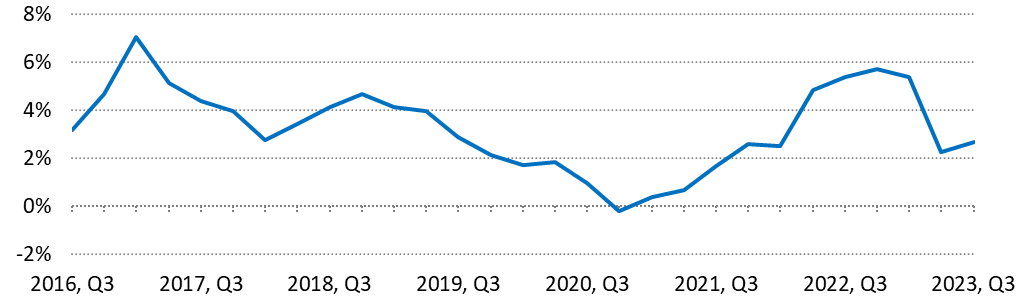
Chart 2. Annual inflation rate, Q4 2016 to Q4 2023
Price changes in the last year
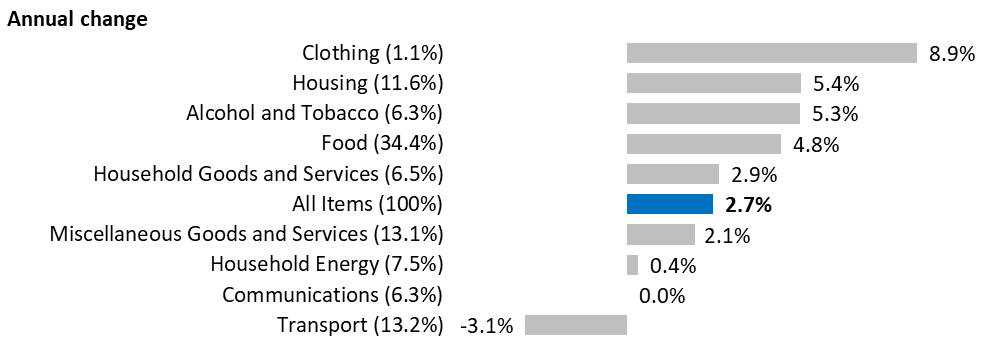
The index uses 203 representative items to measure price changes in nine different major categories of household spending. Since a year ago,87 items increased in price, 38 items decreased in price, and the price of 78 items remained unchanged.
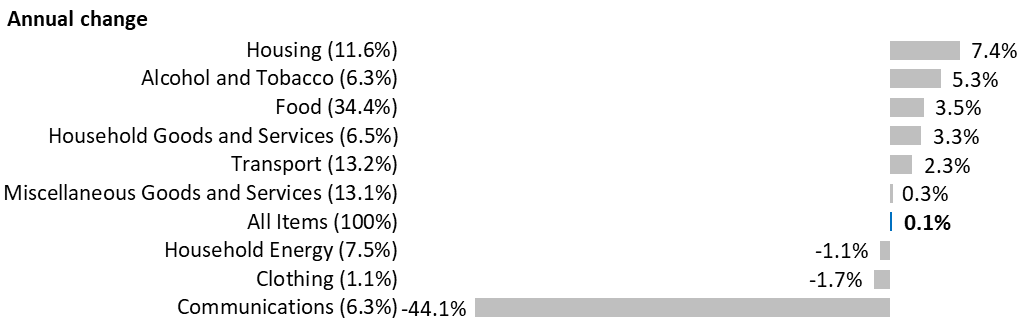
Chart 3. Annual price change by category, St Helena (Q4 2022 compared to Q4 2023)
Note: category weights are provided in parentheses; these indicate the extent to which different categories are represented in the overall index. Categories with higher weight have a greater contribution to the index than categories with lower weights.
Three categories saw a decrease in price since last year (Chart3), although by far the most significant was Communications. On October 1 2023 the service provider (Sure South Atlantic Limited) introduced new tariffs with faster data speeds and bigger transfer allowances and these changes have been incorporated in the calculations for this release of the RPI. The three detailed RPI sub-categories affected by this are pay-as-you-go mobile phone services, pay-monthly mobile phone services, and internet broadband services. After taking into account the changes in both service package price and the quality and quantity of the services provided, as recommended by the United Nations in their Consumer Price Index Manual, it is estimated that, on average, the price of Communications services overall has fallen by 44.1%, compared to Q4 2022. Communications makes up 6.3% of the total RPI ‘shopping basket’, so these changes have had a major impact on the value of the RPI, tending to offset any price increases in other categories during the year.
The price of fuel also increased significantly in Q4 compared to the price in the previous quarter, to £1.99 for a litre of petrol (from £1.88 in Q3) and £2.23 for a litre of diesel (from £1.86). However a year ago, in Q4 2022, petrol was higher, at £2.01 per litre, and diesel was only slightly lower, at £2.16. So this change in the fuel price has not had a major impact on the annual inflation rate.
Price changes in both the UK and South Africa have a strong impact on prices on St Helena, since the majority of goods imported to St Helena are purchased in those two countries. In November 2023, annual consumer price inflation in the UK was measured at 3.9% (UK Office for National Statistics), down from 4.6% in October, and in South Africa it was measured at 5.5% (Statistics South Africa), down from 5.9% in October. Changes in the value of the Rand compared to the Pound can have a large effect on the price of goods purchased in South Africa, and during 2023 the Pound averaged around 23.0 Rand, which is a 14% increase compared to 2022, when it was 20.2. This will have tended to counteract the effect of price inflation in South Africa on the final shop-floor prices on St Helena.
Price changes in the last quarter
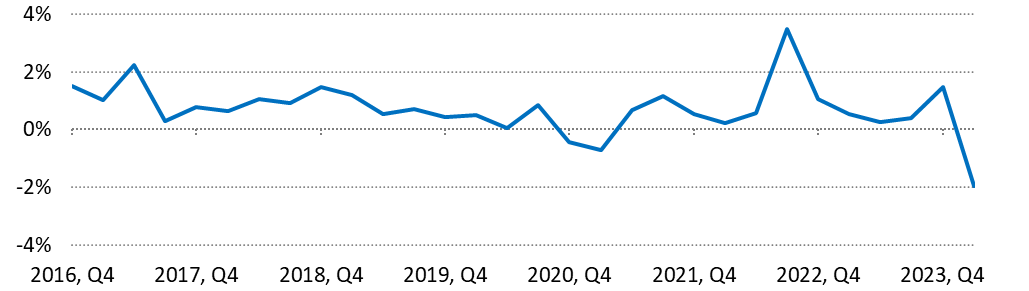
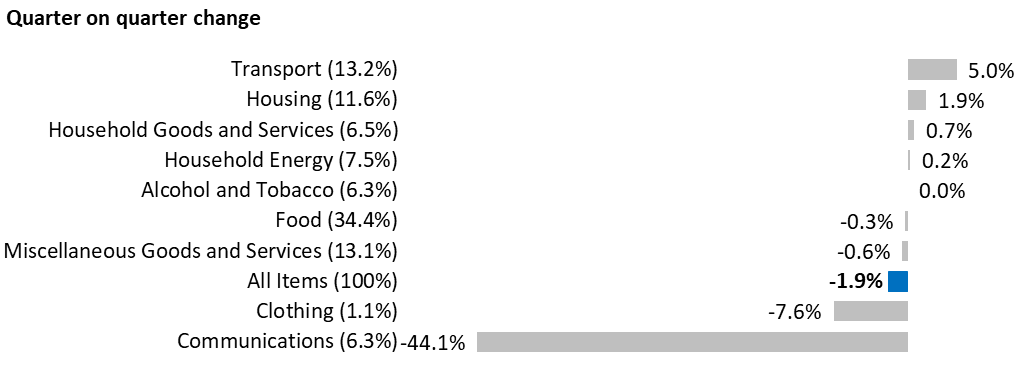
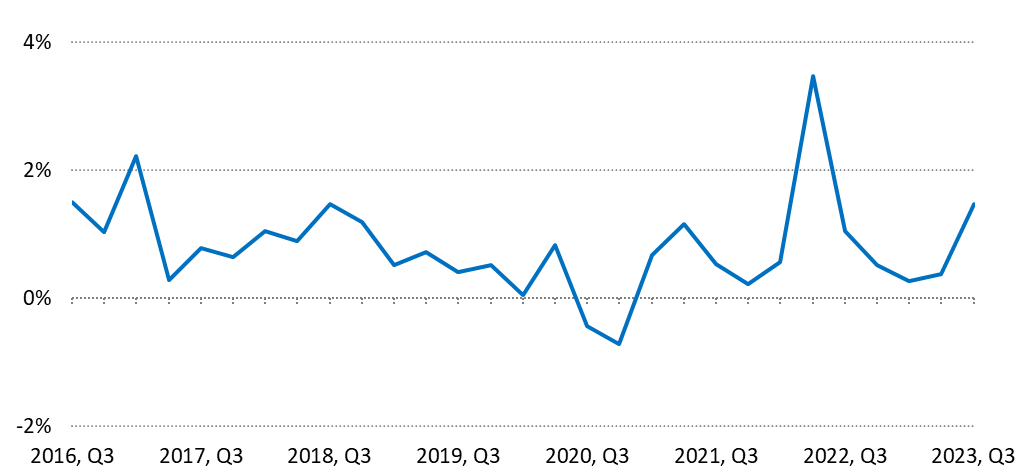
Shorter-term changes in prices can be measured by comparing the index with its value in the last quarter, three months ago (i.e. with Q3 2023). Charts 4 and 5 illustrate these quarterly inflation rates. They are often lower than the annual rates, since they measure price changes over a much shorter period. Between Q3 of 2023 and Q4 of 2023, prices fell on average by 1.9%. In the RPI calculations, 36 prices rose, 25 prices fell, and 142 prices remained unchanged.
Chart 4. Quarterly inflation rate, Q4 2016 to Q3 2023
This negative quarterly inflation rate is largely due to the major changes in the price of mobile and internet data services announced by Sure in October. There were also price decreases, on average, in three other categories (Clothing, Miscellaneous Items and Services, and Food). In part this reflects the strengthening pound compared to the Rand. There was a quarterly rise in average prices in the Transport category, which was mainly due to the increase in the price of Petrol and Diesel.
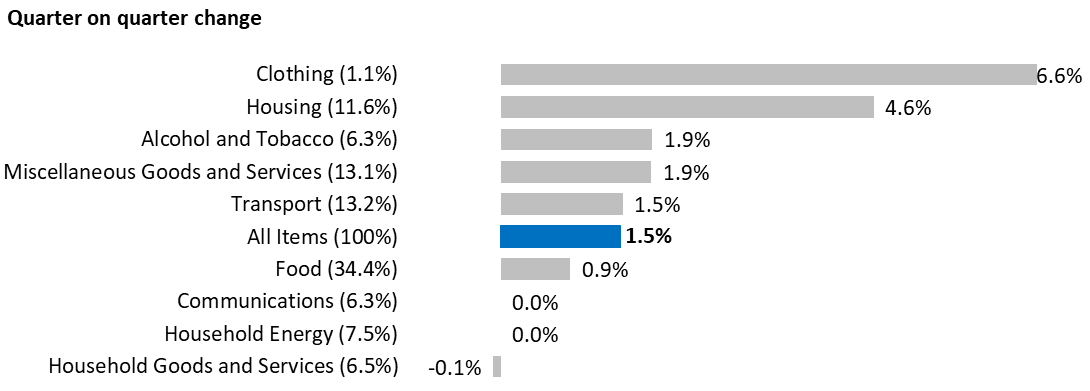
Chart 5. Quarterly price change by category, St Helena (Q3 2023 compared to Q4 2023)
Note: category weights are provided in parentheses; these indicate the extent to which different categories are represented in the overall index. Categories with higher weight have a greater contribution to the index than categories with lower weights.
Frequently Asked Questions
What is price inflation?
Price inflation is the change in the average prices of goods and services over time. The rate of price inflation is calculated from the change in the RPI, which is the official measure of the average change in the prices of goods and services paid by consumers. The RPI is estimated each quarter, i.e. once every three months, and the rate of price inflation is usually quoted on an annual basis; that is, comparing price changes over a 12-month period. Prices and the RPI tend to go up, but they can occasionally go down – which is known as price deflation.
Why do we measure inflation?
An accurate measure of price inflation helps understand the extent and nature of the impact of price changes on the government, businesses, households and individuals. Inflation rates are often used in budgeting and accounting processes so that costs can be adjusted for the effect of price changes.
How is the RPI calculated?
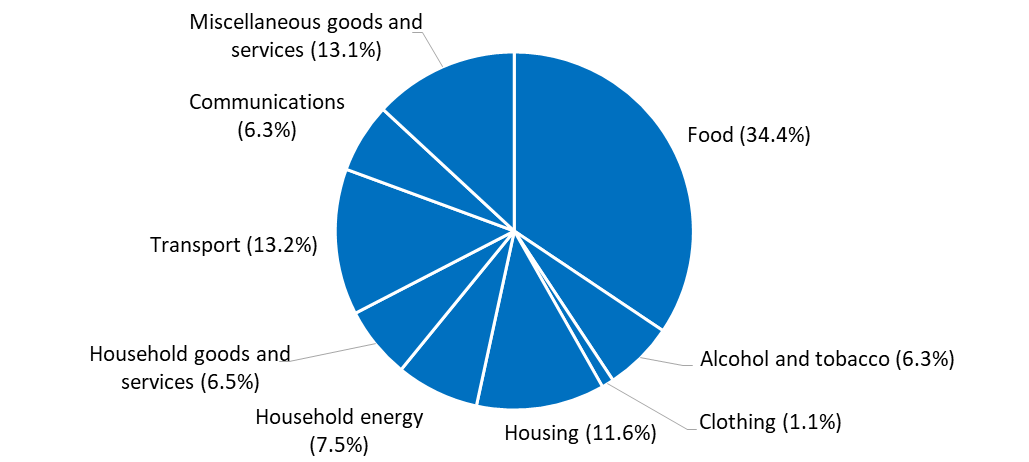
The basis for the RPI is the average weekly cost of goods and services purchased by households on St Helena, sometimes called the RPI ‘shopping basket’. Items which households purchase more of, such as food, have the biggest share of the RPI basket. The current RPI uses a basket from the latest Household Expenditure Survey in 2017; prices representing the groups of items in the basket are collected every quarter, and the price of the total basket is compared to the price in the baseline period, the first quarter of 2018. By convention, the value of the basket in the baseline period is scaled to 100, and the RPI values are quoted in relation to that baseline. For example, an RPI value of 120 means that average prices have increased by 20 per cent compared to those recorded in the baseline period.
Composition of average household weekly expenditure (Q1 2018 RPI ‘Shopping Basket’)
What happens when items are not available?
If an item of the ‘basket’ is not available then either the previous price will be carried forward from the previous quarter, or a suitable substitute item will be identified and an adjustment calculation made. Care is taken to ensure that this substitute item represents the item category and that it does not introduce error to the measurement of the RPI. An important principle is that price changes should reflect actual price increases and decreases, and not changes in the quality of items.
Please get in touch. We are Neil Fantom, Statistical Commissioner, Kelly Clingham and Justine Joshua, Senior Statistical Assistants and Courtney O’Dean, Statistics Assistant. You can find us in person at the Statistics Office on the top floor of the Post Office, Jamestown. You can also contact us by telephone on our direct line through 22138. If calling from overseas, the international dialling code for St Helena is +290. Our general office e-mail address is statistics@sainthelena.gov.sh, or you can email team members directly (the format is firstname.lastname@sainthelena.gov.sh).
The latest estimates have been released for the numbers of passenger arrivals and departures to and from St Helena. Note that these estimates are provisional.
Arrivals
In November 2023, there were a total of 332 arrivals, with 315 arriving by air. 175 people arrived for leisure, including 70 non-St Helenians, and 105 St Helenians visiting family and friends on the island. Within the months of January to November 2023 there have been 3,696 arrivals, compared to 2,468 in the same period of 2022 – a 49.7% increase. Of those arrivals, 1,613 were for a leisure purpose, more than double the number in the same period in 2022 (791), when COVID19 quarantine precautions were still in place.
https://datawrapper.dwcdn.net/EA4bJ/18/
Departures
There were an estimated 221 departures in November 2023, 111 less than the number of arrivals; of these, 204 left by air. During January to November 2023, there were a total of 3,847 departures, compared to 2,655 in the same period in 2022 – an increase of 45%.
https://datawrapper.dwcdn.net/KlqTH/9/
Get the data
A file with detailed monthly statistics on arrivals and departures to November 2023 can be downloaded here (Excel format).
The St Helena Statistics Office has released new estimates for the total population of St Helena, and the number of births and deaths. Please note that the population estimates are provisional.
At the end of November 2023 there were an estimated 4,293 people on the island, an increase from the end of October, when there were an estimated 4,184. Of the people on the island, an estimated 4,104 people were residents. This compares to an estimated 4,074 residents on the island at the end of October, and 4,196 residents on the island a year ago, at the end of November 2022.
https://datawrapper.dwcdn.net/BKVr4/23/
Compared to the end of November 2022 there has been a decrease in the number of resident children on-island (0-14 years) and those of roughly working age (15-64 years), by 42 and 73 respectively, but an increase in those 65 and over, by 23. As a result the Old Aged Dependency Ratio of the resident on-island population (the number of those 65 and over compared to those of roughly working age) is estimated to be 46.5 at the end of November 2023, an increase compared to November 2022, when it was estimated to be 44.2.
A data file with monthly statistics on population estimates to the end of November 2023 can be downloaded here. The file includes population totals, arrivals, departures, births, and deaths.
The St Helena Statistics Office has released new estimates for the total population of St Helena, and the number of births and deaths. Please note that the population estimates are provisional.
At the end of September 2023 there were an estimated 4,203 people on the island, an increase from the end of August, when there were an estimated 4,080, however a drop from the end of September 2022, when there were an estimated 4,300. Of the people on the island, an estimated 4,078 people were residents. This compares to an estimated 3,983 residents on the island at the end of August, and 4,223 residents on the island a year ago, at the end of September 2022.
https://datawrapper.dwcdn.net/BKVr4/22/
Compared to the end of September 2022 there has been a decrease in the number of resident children on-island (0-14 years) and those of roughly working age (15-64 years), by 57 and 113 respectively, but an increase in those 65 and over, by 25. As a result the Old Aged Dependency Ratio of the resident on-island population (the number of those 65 and over compared to those of roughly working age) has gone up, and is estimated to be 46.7 at the end of September 2023, an increase compared to September 2022, when it was estimated to be 43.6.
Get the data
A data file in with monthly statistics on population estimates to the end of September 2023 can be downloaded here. The file includes population totals, arrivals, departures, births, and deaths.
The latest estimates have been released for the numbers of passenger arrivals and departures to and from St Helena. Note that these estimates are provisional.
Arrivals
In September 2023, there were a total of 412 arrivals, with 396 arriving by air. 142 people arrived for leisure, including 72 non-St Helenians, and 70 St Helenians visiting family and friends on the island. In the first nine months of 2023 there have been 3,076 arrivals, compared to 1,873 in the first nine months of 2022 – a 64% increase. Of those arrivals, 1,357 were for a leisure purpose, more than double the number in the same period in 2022 (579), when COVID19 quarantine precautions were still in place.
https://datawrapper.dwcdn.net/EA4bJ/17/
Departures
There were an estimated 289 departures in September 2023, 123 less than the number of arrivals; of these, 278 left by air. In the first nine months of the year there were 3,326 departures, compared to 2,103 in the same period in 2022 – an increase of 58%.
https://datawrapper.dwcdn.net/KlqTH/8/
Get the data
A file with detailed monthly statistics on arrivals and departures to September 2023 can be downloaded here (Excel format).
Estimates of the Retail Price Index and price inflation rates have been calculated for the third quarter of 2023. The data released in this Bulletin can be downloaded in Excel format here, and a PDF version of this Bulletin can be downloaded here. More statistics on St Helena’s economy can be found here.
The Retail Price Index
The Retail Price Index (RPI) is a statistical measure of the change in retail prices on St Helena. An increase in the RPI means that, on average, prices have gone up since the last time they were measured, and a decrease in the RPI means that, on average, prices have fallen. It is important to understand that the RPI is an average measure: if it goes up, it does not mean that all prices have gone up, and similarly, if it goes down, it does not mean that all prices have fallen.
Latest index value and inflation rates
For the third quarter of 2023 the RPI has been measured at 117.0 (Chart 1). A year ago the RPI was 113.9, resulting in an annual inflation rate of 2.7%, comparing average prices in the third quarter of 2023 to the same time period in 2022. This is 0.5 percentage points higher than the previous annual inflation rate for Q2 2023, which was 2.2%, itself down from 5.4% in Q1 2023 (Chart 2).
Chart 1. Retail Price Index, Q3 2016 to Q3 2023
Chart 2. Annual inflation rate, Q3 2016 to Q3 2023
Price changes in the last year
The index uses 203 representative items to measure price changes in nine different categories of household spending. Since a year ago, 85 items increased in price, 28 items decreased in price, and the price of 90 items remained unchanged. All categories within the index saw an increase over the past year (Chart 3), apart from Communications, which has remained unchanged, and Transport, which saw a decrease.
Average prices over the year in the Clothing and Housing categories rose the most, 8.9% and 5.4% respectively. Increases in the average prices of footwear contributed most to the increase in the Clothing category, but the impact of these price changes on the overall index is quite small due to the low weight of the overall category (1.1%). Within the Housing category, there were price increases in some building materials, and the prices for government-landlord housing rent were revised. The Food category rose by 4.8 % compared to the same period in 2022, contributing factors included price increases in some tinned goods and oil-based products.
The fall in the price of Petrol and Diesel over the past year resulted in the decrease in the Transport category. These two commodities have the highest weighting in their category and are also within the top 10 highest weighted commodities in the entire basket. During the year between Q3 2022 and Q3 2023, the price of Petrol fell by 9%, and the price of Diesel fell by 14%.
On October 1, the telecommunication service provider (Sure South Atlantic Limited) introduced a new tariff for broadband internet and mobile phone services, including lowered prices and improved data speeds and allowances. Since they occurred in October these changes are not incorporated in the Q3 2023 RPI, but they will be reflected in Q4, which is due for release in mid-January 2024. International standards for price indices require that they reflect changes in prices for the same level of services, which means that the Q4 2023 RPI is likely to record a large drop in the average price of telecommunication services: consumers can now purchase much better services for a lower price.
Chart 3. Annual price change by category, St Helena (Q3 2022 compared to Q3 2023)
Note: category weights are provided in parentheses; these indicate the extent to which different categories are represented in the overall index. Categories with higher weight have a greater contribution to the index than categories with lower weights.
Price changes in both the UK and South Africa have a strong impact on prices on St Helena, since the majority of goods imported to St Helena are purchased in those two countries. In August 2023, annual consumer price inflation in the UK was measured at 6.7% (UK Office for National Statistics), down from 6.8% in July, and in South Africa it was measured at 4.8% (Statistics South Africa), up from 4.7% in July. Changes in the value of the Rand compared to the Pound also have an effect on the price of goods purchased in South Africa; over the last twelve months the Pound has averaged around 22 Rand, which is stronger than it was in the previous 12 month period. The impact of this is to make goods bought in South Africa cheaper for St Helenian importers, potentially counteracting some of the effect of South African price inflation and any increases in transport costs.
Price changes in the last quarter
Shorter-term changes in prices can be measured by comparing the index with its value in the last quarter, three months ago (i.e. with Q2 2023). Charts 4 and 5 illustrate these quarterly inflation rates. They are often lower than the annual rates, since they measure price changes over a much shorter period. Between Q2 of 2023 and Q3 of 2023, average prices rose by 1.5%: in the RPI calculations, 40 prices rose, 11 prices fell, and 152 prices remained unchanged.
Chart 4. Quarterly inflation rate, Q3 2016 to Q3 2023
On average, prices of items representing Clothing rose the most over the quarter, 6.6%, although prices within this category can be quite volatile, and the weight of Clothing in the RPI is quite low, at 1.1%. Food rose by 0.9% compared to the previous quarter, with the two highest quarterly increases measured in representative items for fresh fruit and vegetables. The Household Goods and Services category saw the biggest fall in average prices over the quarter, a result of the reduction in price of some household cleaning items.
Chart 5. Quarterly price change by category, St Helena (Q2 2023 compared to Q3 2023)
Note: category weights are provided in parentheses; these indicate the extent to which different categories are represented in the overall index. Categories with higher weight have a greater contribution to the index than categories with lower weights.
Some Frequently Asked Questions
What is price inflation?
Price inflation is the change in the average prices of goods and services over time. The rate of price inflation is calculated from the change in the RPI, which is the official measure of the average change in the prices of goods and services paid by consumers. The RPI is estimated each quarter, i.e. once every three months, and the rate of price inflation is usually quoted on an annual basis; that is, comparing price changes over a 12-month period. Prices and the RPI tend to go up, but they can occasionally go down – which is known as price deflation.
Why do we measure inflation?
An accurate measure of price inflation helps understand the extent and nature of the impact of price changes on the government, businesses, households and individuals. Inflation rates are often used in budgeting and accounting processes so that costs can be adjusted for the effect of price changes.
How is the RPI calculated?
The basis for the RPI is the average weekly cost of goods and services purchased by households on St Helena, sometimes called the RPI ‘shopping basket’. Items which households purchase more of, such as food, have the biggest share of the RPI basket. The current RPI uses a basket from the latest Household Expenditure Survey in 2017; prices representing the groups of items in the basket are collected every quarter, and the price of the total basket is compared to the price in the baseline period, the first quarter of 2018. By convention, the value of the basket in the baseline period is scaled to 100, and the RPI values are quoted in relation to that baseline. For example, an RPI value of 120 means that average prices have increased by 20 per cent compared to those recorded in the baseline period.
Composition of average household weekly expenditure (Q1 2018 RPI ‘Shopping Basket’)
What happens when items are not available?
If an item of the ‘basket’ is not available then either the previous price will be carried forward from the previous quarter, or a suitable substitute item will be identified and an adjustment calculation made. Care is taken to ensure that this substitute item represents the item category and that it does not introduce error to the measurement of the RPI. An important principle is that price changes should reflect actual price increases and decreases, and not changes in the quality of items.
Have more questions or comments?
Please get in touch. We are Neil Fantom, Statistical Commissioner, Kelly Clingham and Justine Joshua, Senior Statistical Assistants and Courtney O’Dean, Statistics Assistant. You can find us in person at the Statistics Office on the top floor of the Post Office, Jamestown. You can also contact us by telephone on ourdirect line through 22138. If calling from overseas, the international dialling code for St Helena is +290. Our general office e-mail address is statistics@sainthelena.gov.sh, or you can email team members directly (the format is firstname.lastname@sainthelena.gov.sh).