The St Helena Statistics Office has released new estimates for the total population of St Helena, and the number of births and deaths. Please note that the population estimates are provisional.
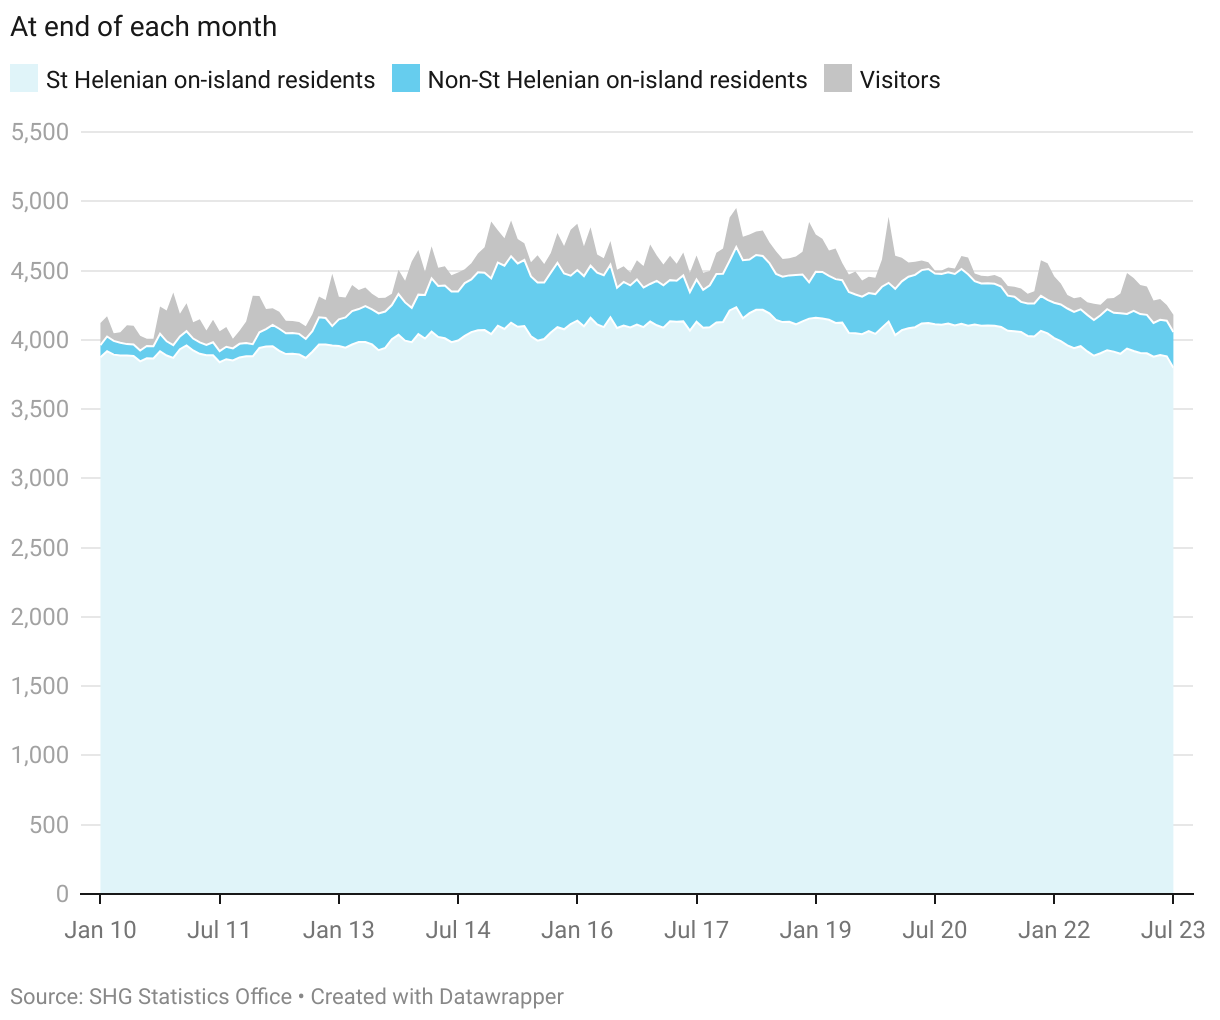
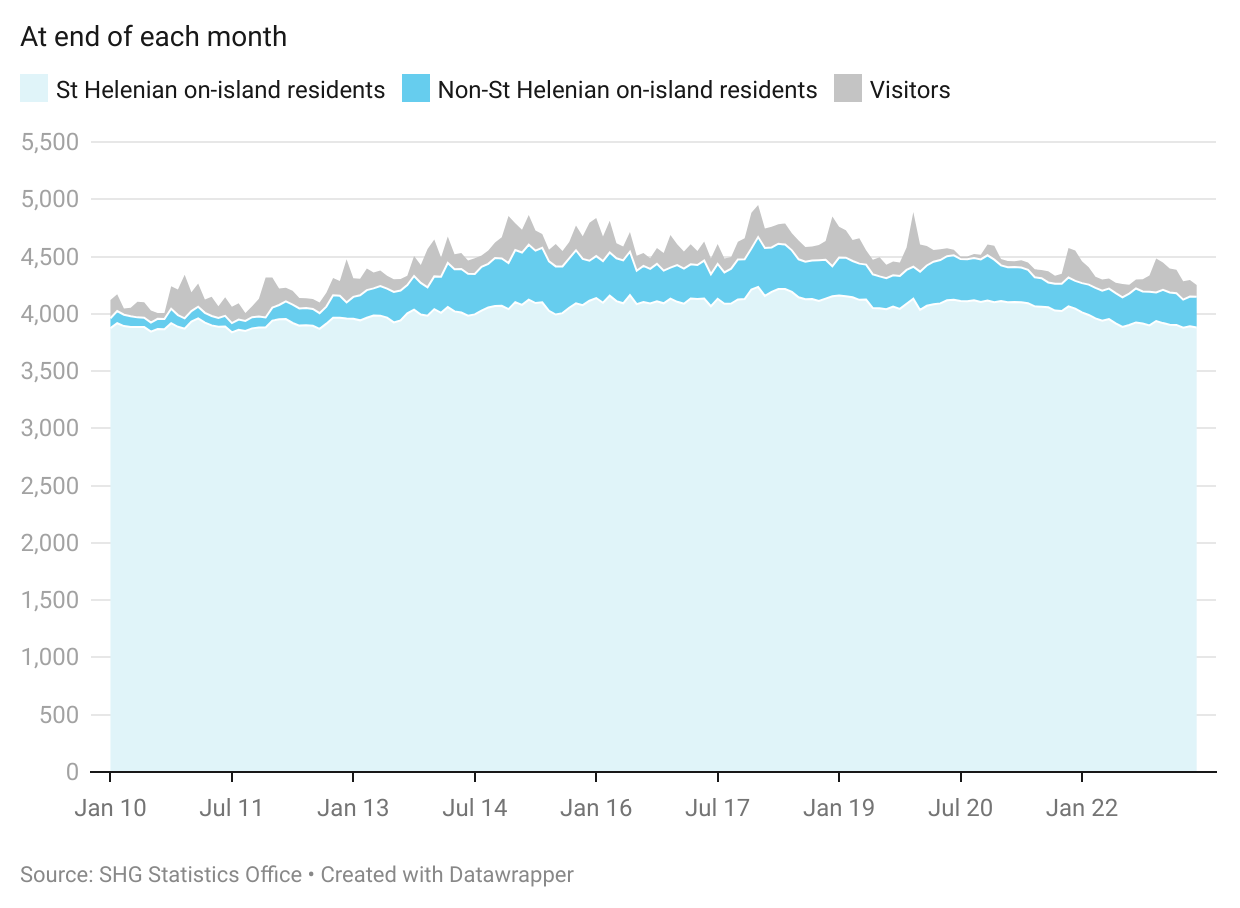
At the end of August 2023 there were an estimated 4,080 people on the island, a drop from the end of July, when there were an estimated 4,181, and from the end of August 2022, when there were an estimated 4,254. Of the people on the island, an estimated 3,987 people were residents. This compares to an estimated 4,045 residents on the island at the end of July, and 4,179 residents on the island a year ago, at the end of August 2022.
https://datawrapper.dwcdn.net/BKVr4/20/
The downward trend is partly explained by the difference between births and deaths; in the twelve months from September 2022 to August 2023 there were 60 deaths on-island, compared to 16 births. And, for August 2023, flight timings and delays around the end of July may have resulted in an unusually large number of departures compared to arrivals. But, nonetheless, there is also a trend that more residents are leaving the island than are arriving, especially among younger age groups. For instance, the number of on-island residents under 65 at the end of August 2023 was estimated to be 2,875, 216 less than the year before. But the estimated number of on-island residents aged 65 and over increased slightly, from 1,088 at the end of August 2022 to 1,112 at the end of August 2023.
Get the data
A data file in with monthly statistics on population estimates to the end of August 2023 can be downloaded here. The file includes population totals, arrivals, departures, births, and deaths.
The latest estimates have been released for the numbers of passenger arrivals and departures to and from St Helena. Note that these estimates are provisional.
Arrivals
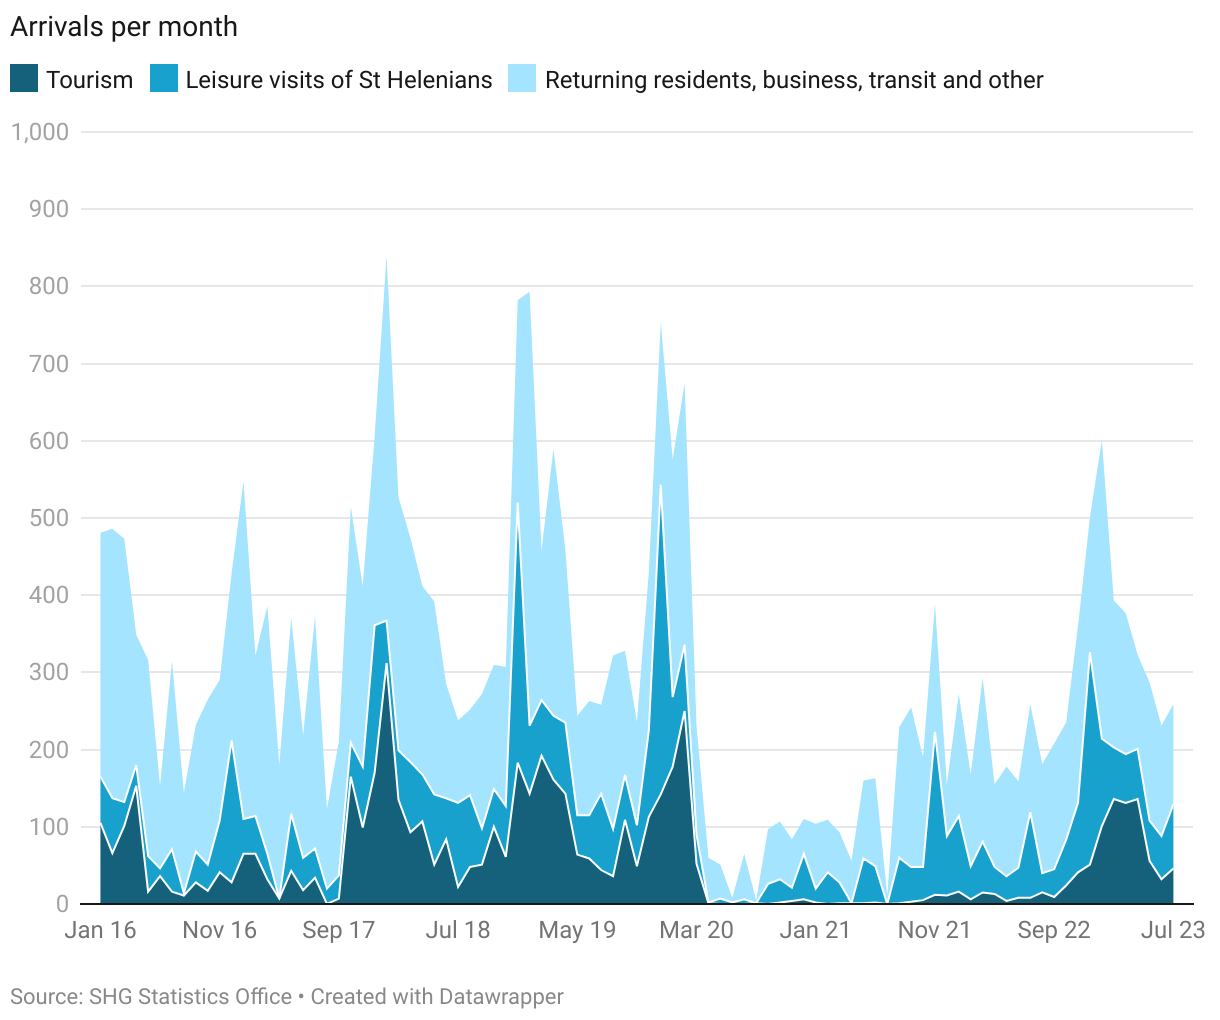
In August 2023, there were a total of 193 arrivals, with 189 arriving by air. 78 people arrived for leisure, including 32 non-St Helenians, and 46 St Helenians visiting family and friends on the island. In the first eight months of 2023 there have been 2,664 arrivals, compared to 1,665 in the first eight months of 2022 – a 60% increase. Of those arrivals, 1,215 were for a leisure purpose, more than double the number in the same period in 2022 (534), when COVID19 quarantine precautions were still in place.
https://datawrapper.dwcdn.net/EA4bJ/15/
Departures
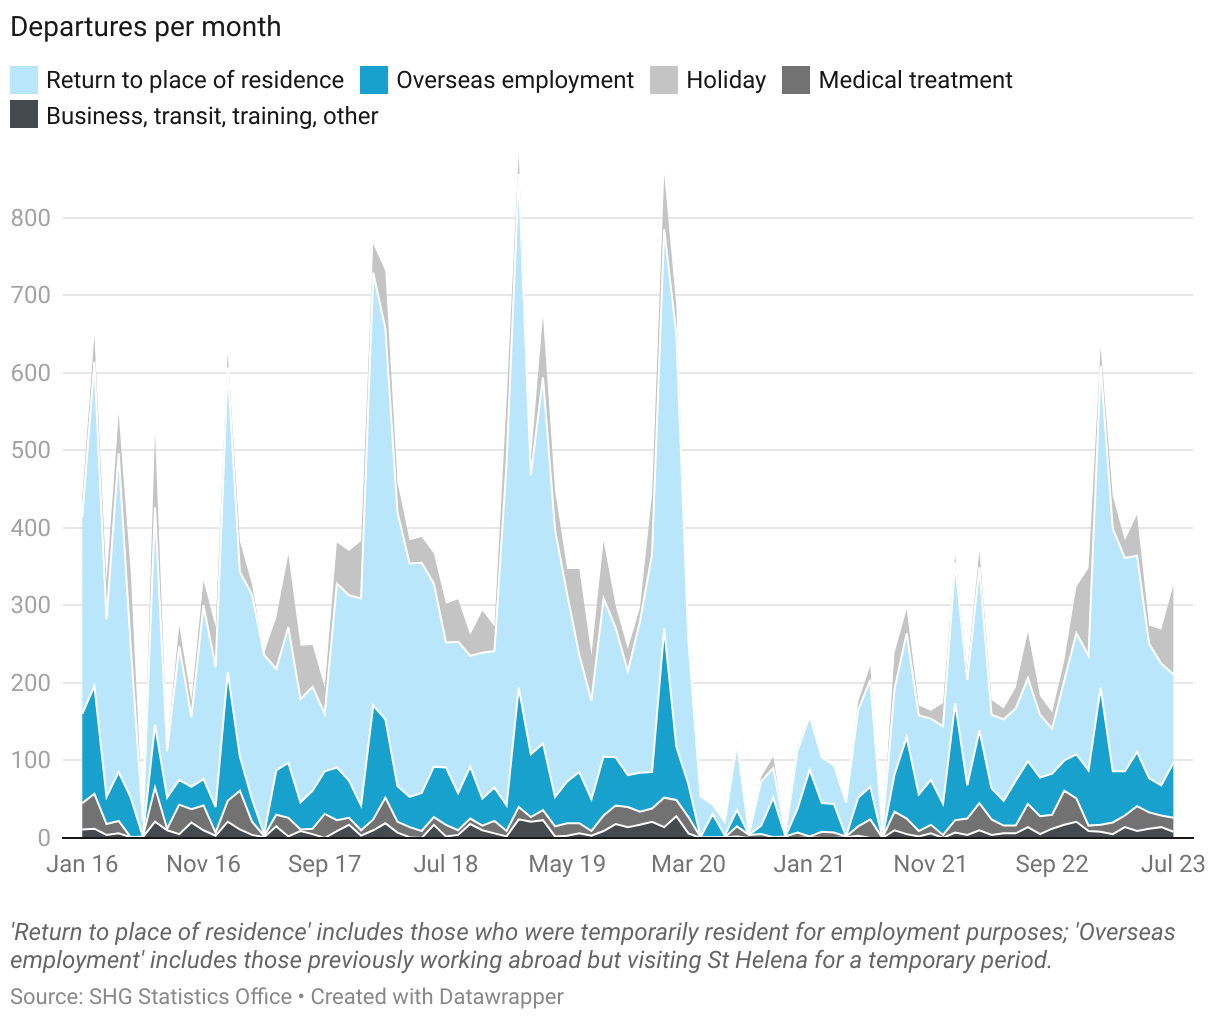
There were an estimated 292 departures in August 2023, 99 more than the number of arrivals; of these, 288 left by air. In the first eight months of the year there were 3,037 departures, compared to 1,941 in the the same period in 2022 – an increase of 56%.
https://datawrapper.dwcdn.net/KlqTH/7/
Get the data
A file with detailed monthly statistics on arrivals and departures to August 2023 can be downloaded here (Excel format).
The St Helena Statistics Office has released new estimates for the total population of St Helena, and the number of births and deaths.
At the end of July 2023 there were an estimated 4,181 people on the island, of which 4,056 were estimated to be residents. A year ago, at the end of July 2022, the estimated on-island population was 79 higher at 4,260, and the estimated on-island residents was 87 higher, at 4,143. Some of this change is due to the difference between births and deaths; between August 2022 and July 2023 there were 60 on-island deaths but only 14 on-island births, causing a drop in the population total by 46 people. Some of this change may also be due to more residents leaving the Island temporarily for holidays or for other purposes in July 2023 than in July 2022, when the COVID-19 travel restrictions were still in place on St Helena.
There were also an estimated 125 visitors on St Helena at the end of July 2023, a slight increase from the previous month (114) and from the end of July 2022 (117).
Compared to the end of July 2022 there has been a decrease in the number of resident children on-island (0-14 years) and those of roughly working age (15-64 years), by 38 and 79 respectively, but an increase in those 65 and over, by 30. As a result the Old Aged Dependency Ratio of the resident on-island population (the number of those 65 and over compared to those of roughly working age) has gone up, and is estimated to be 46.5 at the end of July 2023, an increase compared to July 2022, when it was estimated to be 43.8.
Get the data
A data file in with monthly statistics on population estimates to the end of July 2023 can be downloaded here. The file includes population totals, arrivals, departures, births, and deaths.
The latest estimates have been released for the numbers of passenger arrivals and departures to and from St Helena. Note that these estimates are provisional.
Arrivals
In July 2023, there were a total of 259 arrivals, the same number of arrivals compared to the same period in 2022. Of these July 2023 arrivals, 251 arrived by air and the remaining 8 by sea. 129 people arrived for leisure, including 46 non-St Helenians, and 83 St Helenians visiting family and friends on the island.
Departures
There were an estimated 326 departures in July 2023, 67 more than the number of arrivals. Of these, 316 left by air and the remaining 10 by sea. Compared to the same month a year ago this is an increase of 60 departures, or 23%.
Get the data
A file with detailed monthly statistics on arrivals and departures to July 2023 can be downloaded here (Excel format).
This Bulletin releases new estimates of the value of goods imported to St Helena during the 2022/23 financial year. Detailed data tables accompany this release and can be downloaded here, and a PDF version of this Bulletin can be dowloaded here.
Value of goods imported
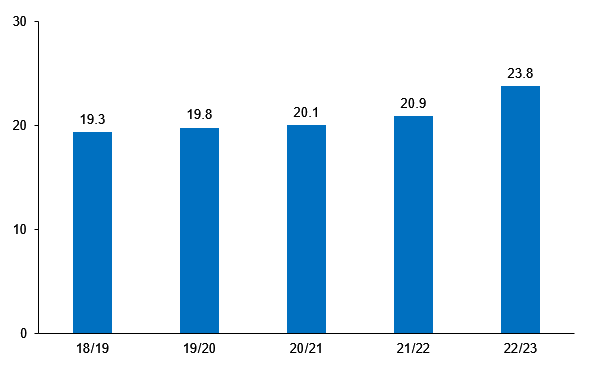
Chart 1 shows the total value of goods imported to St Helena for the last five years, which increased over this period by 23%. Most of this is due to inflation in the prices of goods purchased overseas, particularly in the United Kingdom and South Africa. The total value of imported goods in 2022/23 was £23.8 million, a 13.6% increase on 2021/22 (£20.9 million). However, much of this increase was due to the increase in price of imported mineral fuels, especially diesel and petrol. The price of these fuels increased by more than 50%, a consequence of the end of the COVID19 pandemic and the conflict in Ukraine.
Chart 1. Total imports of goods to St Helena, 2018/19 to 2022/23, £ millions (current prices, not adjusted for inflation)
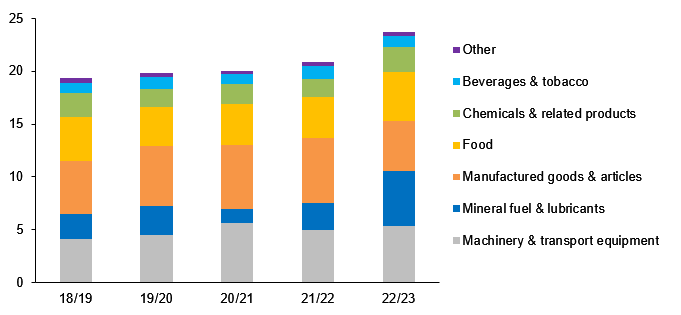
Type of goods imported
Chart 2 shows imports for the last five financial years, classified into broad commodity groups. A large proportion of the value of St Helena’s imports are manufactured goods, machinery, and transport equipment. Road Vehicles is a major item in this group, with an imported value of £2.1m in 2022/23 and £1.4m the year before (2021/22); this category includes passenger cars and trucks, buses, commercial vehicles, and parts and spares.
Imports of machinery, manufactured goods, and vehicles vary from year to year and can be affected by large-scale infrastructure projects. For instance, in 2017/18, some of these imports were related to construction work connected to the Airport project, and more recently some imports in these categories were related to goods, machinery and equipment for the new undersea telecommunications cable and other infrastructure projects.
Chart 2. Imports of goods to St Helena by broad commodity group, 2018/19 to 2022/23, £ millions (current prices, not adjusted for inflation)
Some commodities are imported infrequently in bulk; the most significant is mineral fuel, which is imported via a fuel tanker arriving roughly once every three months, or four times a year, plus smaller quantities of aviation fuel imported via a general cargo ship. Although consumption of fuel is usually quite steady – it is used to generate electricity, and for air, road and sea transport – the annual total value of imports can vary depending on the timing of the arrival of the fuel tanker, as well as the price paid. This may help to explain the large increase in the value of fuel imports in 22/23, when the price of diesel and petrol increased by more than 50%, and there were five tanker deliveries. In 21/22 the volume of diesel and petrol delivered to the island was 3.5 million litres, or 883 thousand litres per delivery; in 22/23 4.1 million litres were delivered, about 828,000 litres per delivery.
Imports of food, beverages and tobacco
Food is the fourth largest group of imported goods in 22/23, with a value of £4.6m. Within the broad food grouping, imports of meat products had the highest value in 2022/23 of £993 thousand (Table 1). Cereals and cereal preparations were second (£844 thousand), and vegetables and fruit, and dairy products and eggs, were third and fourth in the table (£664 thousand and £570 thousand, respectively). The value of food imports increased in 22/23 by 15.8% compared to 21/22. Some of this increase is attributable to increases in the price of food in South Africa and the United Kingdom, although it is likely that not all of these price increases were passed to the consumer because import duties on food were lowered as a result of a St Helena Government policy to manage the high rates of inflation experienced globally in 2022/23.
The value of alcoholic beverages imported in 2022/23 was £452 thousand (before duty and freight charges), a decrease in the value in 2022/23. The value of tobacco imports was £235 thousand, an increase in the value compared to 2021/22.
Table 1. Imports of food, beverages and tobacco, 2019/20 to 2022/23, £ thousands (current prices, not adjusted for inflation)
19/20
20/21
21/22
22/23
Food
3,639
3,842
3,947
4,570
Meat and meat preparations
775
670
953
993
Cereals and cereal preparations
532
670
666
844
Vegetables and fruit
554
530
540
664
Dairy products and eggs
480
429
505
570
Other food products
502
810
408
543
Coffee, tea, cocoa, spices
271
289
338
389
Animal feed
343
277
340
379
Sugars and sugar preparations
122
118
131
118
Fish, crustaceans, molluscs
59
49
66
70
Beverages and tobacco
1,152
1,000
1,277
1,050
Alcoholic beverages
580
494
713
452
Non-alcoholic beverages
386
335
389
363
Tobacco and tobacco products
185
171
175
235
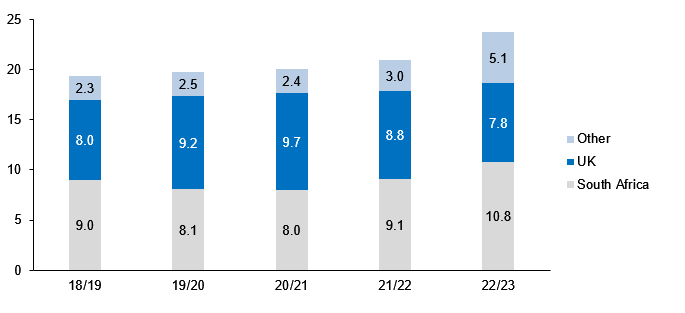
Country of purchase of imported goods
Most goods imported to St Helena are purchased in the United Kingdom or South Africa, reflecting the close ties between St Helena and the UK, and the historical cargo shipping routes between Cape Town in South Africa and Jamestown in St Helena. Historically, St Helenians tend to spend roughly the same in the UK and South Africa on imported goods (see Chart 3), although in 2022/23 more was spent in South Africa (£10.8 million) than the United Kingdom (7.8 million). Imports from other countries are mostly mineral fuel (see Table 2), which was until recently purchased from the Netherlands, but has been purchased from Namibia from 2022/23.
Some of the trends in Chart 3 are caused by price inflation and by the change in the value of the Rand compared to the Pound: goods from South Africa must be bought in Rand, the South African currency, and so the value of goods imported from there may reflect the value of the Rand compared to the St Helena Pound at the time of purchase. When the Rand weakens compared to the Pound, St Helenian importers can buy more goods with the same amount of St Helena Pounds – providing the price of those goods in Rand remains unchanged (in practice, a weakening currency is likely to result in price increases).
Chart 3. Imports of goods to St Helena by recorded country of purchase, 2018/19 to 2022/23, £ millions (current prices, not adjusted for inflation)
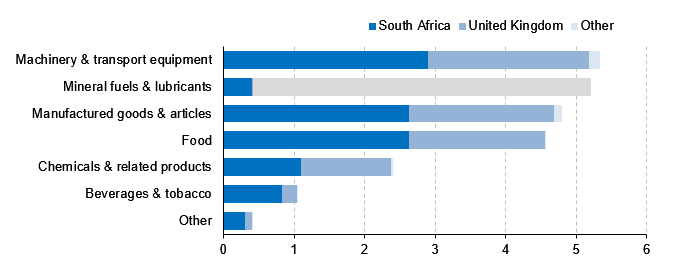
In 2022/23, almost 60% of all food imports were from South Africa, with over 40% from the United Kingdom (Table 2 and Chart 4). In the same year, more than half of the value of all machinery and transport equipment purchased was paid to South African suppliers, and most mineral fuel was purchased from suppliers in other countries. Over 80% of the value of imports for beverages and tobacco products was spent in South Africa.
Table 2. Imports of goods to St Helena by broad commodity group and country of purchase, 2022/23, £ millions
South Africa
United Kingdom
Other
Total
Machinery & transport equipment
2.90
2.28
0.16
5.34
Mineral fuels & lubricants
0.41
0.01
4.79
5.21
Manufactured goods & articles
2.63
2.05
0.11
4.79
Food
2.63
1.92
0.01
4.57
Chemicals & related products
1.11
1.27
0.03
2.40
Beverages & tobacco
0.83
0.22
0.00
1.05
Other
0.31
0.10
0.00
0.40
Total
10.82
7.84
5.10
23.76
Chart 4. Imports of goods to St Helena by broad commodity group and country of purchase, 2022/23, £ millions
Methodology
The compilation methodology for international trade statistics on St Helena uses the guidelines published by the United Nations Statistics Division. More details on the international concepts and definitions can be found here: https://unstats.un.org/unsd/trade/imts/methodology.asp.
Data source
Statistics of imports of goods are derived primarily from the administrative records resulting from the Customs process, particularly the legal requirement for a declaration to be made to the Customs authorities whenever goods are imported or exported. These declarations are stored in a computer system called ASYCUDA, managed by the Customs Office. Although the Statistics Office conducts a number of consistency checks to identify and correct valuation and classification errors, the data quality of statistics on international trade depends on the quality of information entered into the ASYCUDA system by importers and by Customs officials.
Imports and exports
Generally, imports and exports are transactions involving the exchange of goods or services between residents and non-residents of St Helena. For goods, imports and exports are usually recorded whenever a commodity crosses St Helena’s boundaries, typically a border entry point, or a ‘bonded’ warehouse (a place where goods liable to import taxes are stored until those taxes are paid). For the purpose of St Helena’s import statistics, the date of customs duty assessment is usually taken to be a reasonable estimate of the date at which the commodity has effectively crossed the border.
Valuation
Values are reported in ‘current’ prices, that is, the value recorded at the time of the customs transaction, without any adjustment for price inflation (i.e. the changes in prices of commodities over time).
On St Helena, the value recorded by importers for the assessment of import taxes and duties is ‘free-on-board’ (or FOB), rather than inclusive of ‘cost, insurance and freight’ (or CIF); import statistics are therefore also based on the FOB valuation of goods. This means that St Helena’s import statistics are based on the invoice value paid by the importer in the country of purchase, and they do not include the costs of shipment, or any duties or taxes paid.
Goods are counted as imported when they enter the domestic economy; in this regard, goods imported into bonded warehouses are only counted when they are released from bond. Goods imported after being temporarily exported for repair are also not included. Similarly, machinery imported on a temporary basis, for example to support construction products, is not included.
Goods purchased with prices in foreign currency (such as the Rand) are valued in Pounds based on the exchange rate used for the Customs transaction, rather than the exchange rate used by the importer when they purchased the goods.
Volumes
The quality of the information collected by the Customs Office on the quantities of commodities imported does not currently permit the calculation of trade statistics on volumes or quantities.
Classification of commodities
Commodities are classified by importers on their customs declarations using an eight digit tariff code, which is based on the international six digit ‘Harmonised System’ classification maintained by the World Customs Organisation. In this report, and for the presentation of St Helena’s trade statistics generally, the Standard International Trade Classification is also used; this was developed for analytical purposes by the United Nations Statistics Division, while the Harmonised System is primarily designed for the administration of Customs systems. There are ‘correspondence tables’ between these two classification systems maintained by the United Nations, which enables St Helena’s trade statistics to be analysed and presented using either classification.
Data frequency
The trade statistics in this Bulletin are presented by financial year, and the Statistics Office currently analyses the ASYCUDA database every year. However, data are computed by quarter, which can allow calculation of trade statistics by calendar year, or by quarter if required. Any analysis of quarterly import statistics should be made with care, however, since they can be affected by the timing of cargo shipments in particular.
Trade in services
This Bulletin focuses on the imports of goods but it should be noted that St Helena’s trade with other countries also includes imports and exports of services. Imports of services include medical treatment and training programmes abroad, communications services, and services delivered by persons visiting the Island but who do not live on St Helena. St Helena’s service exports include spending on St Helena by tourists and short-term visitors; estimates of this non-resident spending on St Helena are available through the St Helena Statistics Office website.
We welcome comments and suggestions on any of the statistics published by the Statistics Office. Please email: statistics@sainthelena.gov.sh, call tel: 22138, or visit the office in person on the top floor of the Post Office Building, Jamestown.
The St Helena Statistics Office has released new estimates for the total population of St Helena, and the number of births and deaths. At the end of June 2023 there were an estimated 4,252 people on the island, of which 4,148 were estimated to be residents. This is 32 lower than a year ago, when the estimated on-island population stood at 4,272, and residents numbered 4,180. There were also an estimated 104 visitors on St Helena at the end of June 2023, this represents a 28% decrease from the previous month of May (144), but is a 13% increase compared to a year ago (92).
Compared to June 2022 there has been a decrease in the number of children living on the island (0-14 years) and those of roughly working age (15-64 years), by 6.7% and 0.9% respectively, but an increase in those 65 and over, by 2.7%. The Old Aged Dependency Ratio of the resident population (the number of those 65 and over compared to those of roughly working age) is estimated to be 45.1 at the end of June 2023, an increase compared to June 2022, when it was estimated to be 43.5.
Get the data
A data file in Excel format with statistics on population (population totals, arrivals, departures, births, deaths and the age and sex structure of the resident population) can be downloaded here.
The latest estimates have been released for the numbers of arrivals and departures to and from St Helena. In June 2023, there were a total of 231 arrivals, an increase of 72 arrivals compared to the same period in 2022 (159). Of these June 2023 arrivals, 200 arrived by air and the remaining 31 by sea; 88 people arrived for leisure, including tourists and St Helenians visiting family and friends on the island.
https://datawrapper.dwcdn.net/EA4bJ/8/
There were an estimated 269 departures in June 2023, 38 more than the number of arrivals. Of these, 215 left by air and the remaining 54 by sea; compared to the same month a year ago this is an increase of 39%, or 75 departures.
https://datawrapper.dwcdn.net/KlqTH/6/
Get the data
A data file in Excel format with detailed statistics on arrivals and departures can be downloaded here.
New estimates of the Retail Price Index and Inflation for Quarter 2, 2023
Estimates of the Retail Price Index and price inflation rates have been calculated for the second quarter of 2023. Detailed statistics in Excel format, including price indices and inflation rates by category of expenditure, can be downloaded here, and a PDF version of this Statistical Bulletin can be downloaded here.
About the Retail Price Index
The Retail Price Index (RPI) is a statistical measure of the change in retail prices on St Helena. An increase in the RPI means that, on average, prices have gone up since the last time they were measured, and a decrease in the RPI means that, on average, prices have fallen. It is important to understand that the RPI is an average measure: if it goes up, it does not mean that all prices have gone up, and similarly, if it goes down, it does not mean that all prices have fallen.
Latest index value and inflation rates
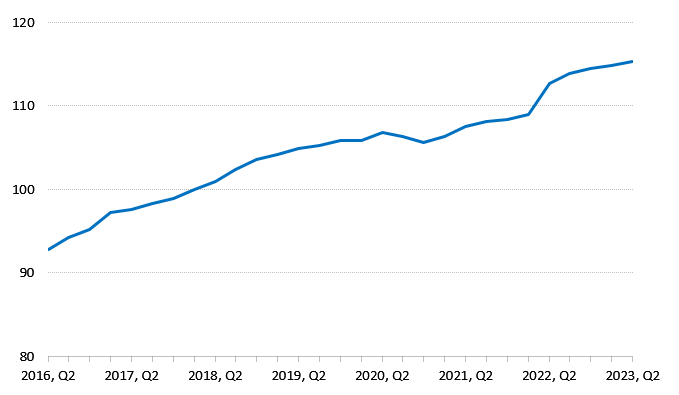
For the second quarter of 2023 the RPI has been measured at 115.3, an increase compared to the first quarter, when it was 114.8 (Chart 1).
Chart 1. Retail Price Index, Q2 2016 to Q2 2023
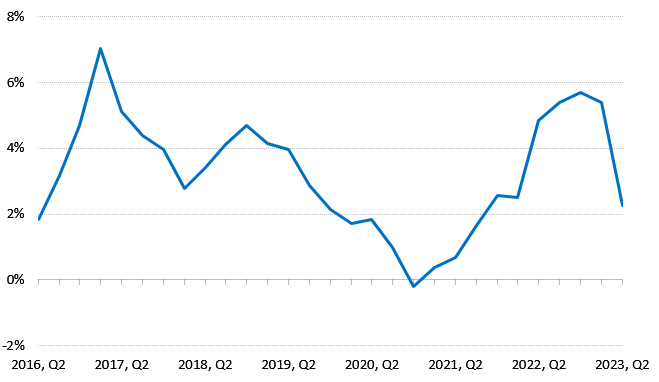
A year ago the RPI was 112.8, resulting in an annual inflation rate of 2.2%, comparing prices in the second quarter of 2023 to the same time period in 2022. The previous annual inflation rate (Q1 2023) was 5.4% (Chart 2).
Chart 2. Annual inflation rate, Q2 2016 to Q2 2023
Price changes in the last year
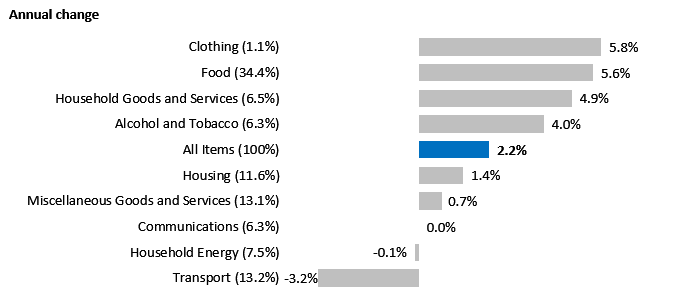
The index uses 203 representative items to measure price changes in nine different categories of household spending. Since a year ago, 81 items increased in price, 31 items decreased in price, and the price of 91 items remained unchanged. All categories within the index saw an increase over the past year (Chart 3), apart from Communications, which has remained unchanged, and the Transport and Household Energy categories.
Average prices over the year in the Clothing and Food categories rose the most, 5.8% and 5.6% respectively. Changes in stock and increases in the average prices of footwear contributed to the increase in the Clothing category, although the impact of these price changes on the overall index is quite small because Clothing has a low weight (1.1%). Food was impacted most by increases in oil-based products, including cooking oil, likely due to the continued effect of the conflict in Ukraine.
The decrease in the Transport category is a result of the recent fall in the price of Petrol and Diesel, compared to the price a year ago, even though the price of these two commodities is still relatively high compared to prices in 2021 – last year, in the second quarter of 2022, fuel prices rose by an average of 60% compared to prices in 2021.
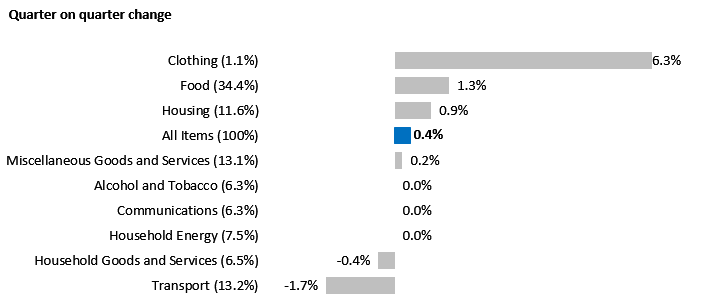
Chart 3. Annual price change by category, St Helena (Q2 2022 compared to Q2 2023)
Note: category weights are provided in parentheses; these indicate the extent to which different categories are represented in the overall index. Categories with higher weight have a greater contribution to the index than categories with lower weights.
Price changes in both the UK and South Africa have a strong impact on prices on St Helena, since the majority of goods imported to St Helena are purchased in those two countries. In May 2023, annual consumer price inflation in the UK was measured at 8.7% (UK Office for National Statistics) unchanged from April, and in South Africa it was measured at 6.3% (Statistics South Africa) down from 6.8% from April. Changes in the value of the Rand compared to the Pound also have an effect on the price of goods purchased in South Africa, and over the last twelve months the Pound has fluctuated around 21 Rand per Pound, peaking at around 23 Rand per Pound in June this year – in other words, the Pound is stronger against the Rand than it was in 2022. The impact of this is that goods from South Africa become slightly cheaper for St Helenian importers.
Price changes in the last quarter
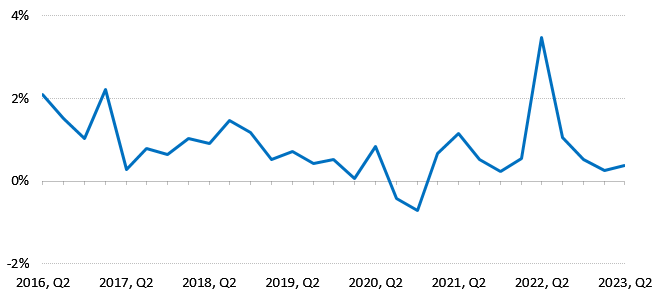
Shorter-term changes in prices can be measured by comparing the index with its value in the last quarter, three months ago (i.e. with Q1 2023). Charts 4 and 5 illustrate these quarterly inflation rates; typically they are often lower than the annual rates, since they measure price changes over a much shorter period. Between Q1 of 2023 and Q2 of 2023, average prices rose by 0.4%: 30 prices rose, 19 prices fell, and 154 prices remained unchanged.
Chart 4. Quarterly inflation rate, Q2 2016 to Q2 2023
On average, prices of items representing Clothing rose the most over the quarter, 6.3% between Q1 and Q2 of 2023, although prices within this category can be quite volatile (due to changes in the items stocked by retailers), and the weight of Clothing in the RPI is quite low, at 1.1%. Food rose by 1.3% compared to the previous quarter, with the two highest quarterly increases measured in representative items for fresh fruit and cooked meals. The Transport category saw the biggest fall in average prices over the quarter, with the same cause as the fall in the annual inflation rate, namely the recent decrease in both petrol and diesel prices in July 2023.
Chart 5. Quarterly price change by category, St Helena (Q1 2023 compared to Q2 2023)
Note: category weights are provided in parentheses; these indicate the extent to which different categories are represented in the overall index. Categories with higher weight have a greater contribution to the index than categories with lower weights.
Some Frequently Asked Questions
What is price inflation?
Price inflation is the change in the average prices of goods and services over time. The rate of price inflation is calculated from the change in the RPI, which is the official measure of the average change in the prices of goods and services paid by consumers. The RPI is estimated each quarter, i.e. once every three months, and the rate of price inflation is usually quoted on an annual basis; that is, comparing price changes over a 12-month period. Prices and the RPI tend to go up, but they can occasionally go down – which is known as price deflation.
Why do we measure inflation?
An accurate measure of price inflation helps understand the extent and nature of the impact of price changes on the government, businesses, households and individuals. Inflation rates are often used in budgeting and accounting processes so that costs can be adjusted for the effect of price changes.
How is the RPI calculated?
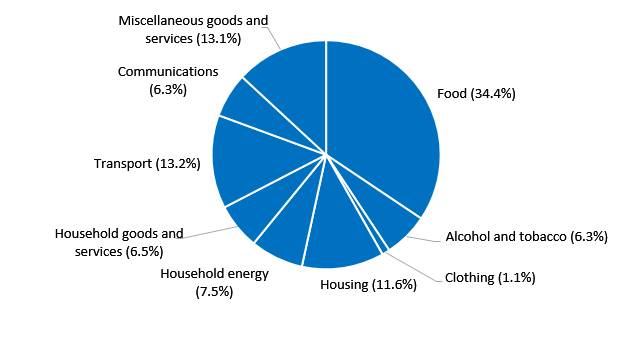
The basis for the RPI is the average weekly cost of goods and services purchased by households on St Helena, sometimes called the RPI ‘shopping basket’. Items which households purchase more of, such as food, have the biggest share of the RPI basket. The current RPI uses a basket from the latest Household Expenditure Survey in 2017; prices representing the groups of items in the basket are collected every quarter, and the price of the total basket is compared to the price in the baseline period, the first quarter of 2018. By convention, the value of the basket in the baseline period is scaled to 100, and the RPI values are quoted in relation to that baseline. For example, an RPI value of 120 means that average prices have increased by 20 per cent compared to those recorded in the baseline period.
Composition of average household weekly expenditure (Q1 2018 RPI ‘Shopping Basket’)
What happens when items are not available?
If an item of the ‘basket’ is not available then either the previous price will be carried forward from the previous quarter, or a suitable substitute item will be identified and an adjustment calculation made. Care is taken to ensure that this substitute item represents the item category and that it does not introduce error to the measurement of the RPI. An important principle is that price changes should reflect actual price increases and decreases, and not changes in the quality of items.
The latest statistical estimates have been revised and released for population and births and deaths for May 2023. Please note that this also includes a revision to the previously released estimates for May 2022 to May 2023.
At the end of May 2023, there were an estimated 4,295 people on the island, of which 4,158 were estimated to be residents. This is slightly less compared to the end of May 2022, when the estimated on island population stood at 4,309 and residents numbered 4,220.
There were also an estimated 137 visitors on St Helena at the end of May 2023, this represents a 13% decrease from the previous month of April (157) but is also a 54% increase compared to May 2022, a year ago (89).
https://datawrapper.dwcdn.net/BKVr4/17/
In the last twelve months, there has been a decrease in the number of children (0-14 years) and those of roughly working age (15-64 years), by 5.6% and 2.0% respectively, but an increase in those 65 and over, by 2.0%. The Old Aged Dependency Ratio of the resident population (the number of those 65 and over compared to those of roughly working age) is estimated to be 45.0 at the end of May 2023, an increase compared to May 2022, when it was estimated to be 43.2.
Before 2000, the number of births each year exceeded the number of deaths. However, since then, the number of deaths has exceeded births in almost every year. In the last twelve months, there were 60 deaths and 13 births, including those that occurred off-island. In the first five months of 2023, there have been only three births, but 24 deaths.
https://datawrapper.dwcdn.net/IoHs8/8/
Get the data
A data file in Excel format with statistics on population (arrivals, departures, births, deaths and resident population sex/age breakdowns) can be downloaded here.